AI Statistics 2024
Artificial intelligence (AI) is a rapidly growing field with the potential to revolutionize many aspects of our lives, from how we work to how we travel and communicate. According to the latest artificial intelligence statistics, the global AI market is also an economic powerhouse, worth almost $455bn.
To understand the varying ways AI affects our lives today and the potential economic impacts, the AIPRM team has compiled an AI statistics report with the latest facts and stats from 2023 and beyond. We will share statistics on market size and how businesses are using AI to improve the customer experience and save money, as well as provide a glimpse of what the future might hold for us in a world of AI.
Top 10 AI statistics 2024 #
-
As of 2023, the global AI market size is worth an estimated $454.12bn.
-
The North American AI market is the largest in the world, with a 36.84% market share.
-
At a growth rate of 19% per year, the AI market value could be more than $2,500bn by 2032.
-
The U.S. government spent $3.28bn on AI investment in 2022.
-
The most common use of AI in business is for customer service (56%).
-
AI is predicted to contribute a 21% net increase to the U.S. GDP by 2030.
-
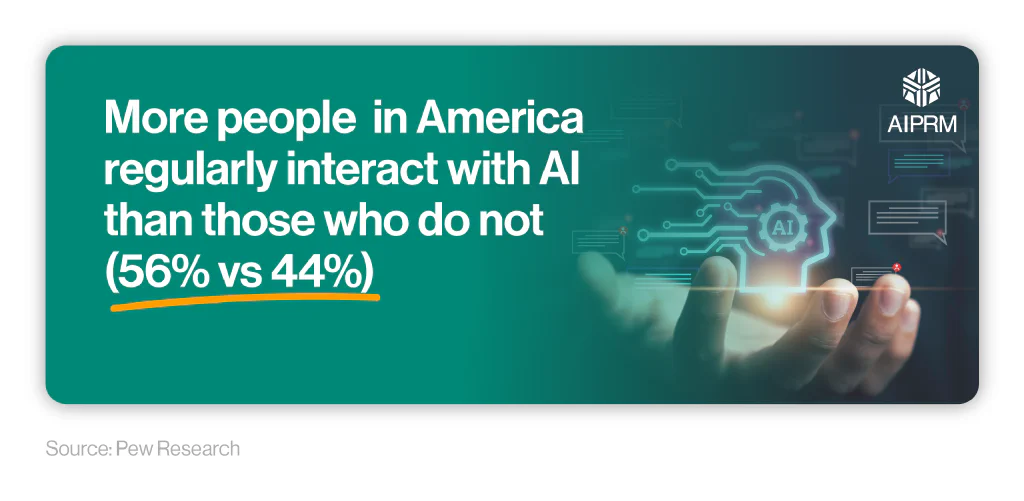
More than half (56%) of Americans regularly interact with AI.
-
In 2023, the most popular type of AI job in the U.S. was Data Engineer, accounting for almost a quarter (23.8%) of all AI-related jobs.
-
As of 2023, the median average salary for an entry-level AI job in the U.S. was $105,092, compared to $195,787 for an executive-level position.
-
More than three-quarters (79%) of SME owners surveyed by Microsoft wanted to learn more about the benefits of AI in the workplace and how it could apply to their company.
AI market size statistics #
As of 2023, the artificial intelligence market size was valued somewhere between $136.55bn and $454.12bn.
AI market size statistics by region #
The largest AI market size is found in North America. With an estimated value of between $87.18bn and $167.3bn in the U.S. and $43.7bn in Canada, the North American AI industry accounts for more than a third (36.84%) of the global AI market share.
A breakdown of AI market size statistics by region (2022) #
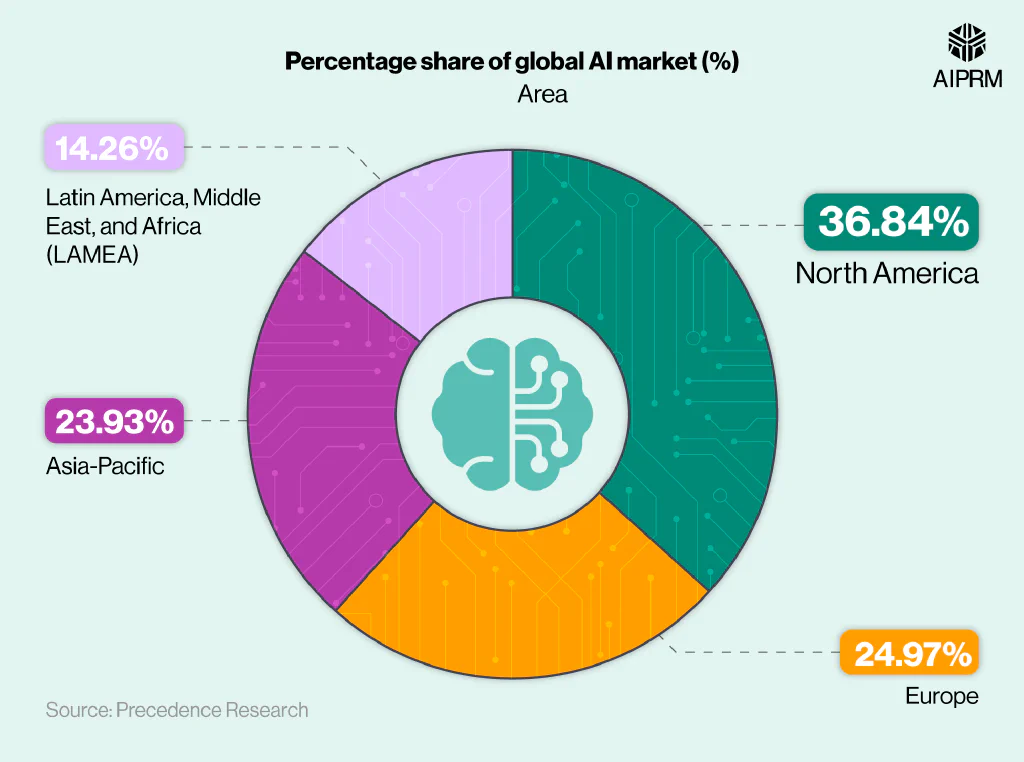
AI stats reveal that almost a quarter (24.97%) of the global AI market share for 2022 was based in Europe, with Germany’s AI market valued at $25.7bn – over 146% less than the U.S.
Likewise, the Asia-Pacific region also contributes a significant proportion (23.93%) of the total AI market size. Japan and South Korea, in particular, are important players in the world of AI, valued at $20.2bn and $16.3bn, respectively, as of 2022.
AI growth statistics #
Artificial intelligence growth statistics reveal the global AI market size could exceed $2,500bn by 2032, at a compound annual growth rate (CAGR) of +19% during this period.
A breakdown of global AI growth statistics between 2022 and 2032 #
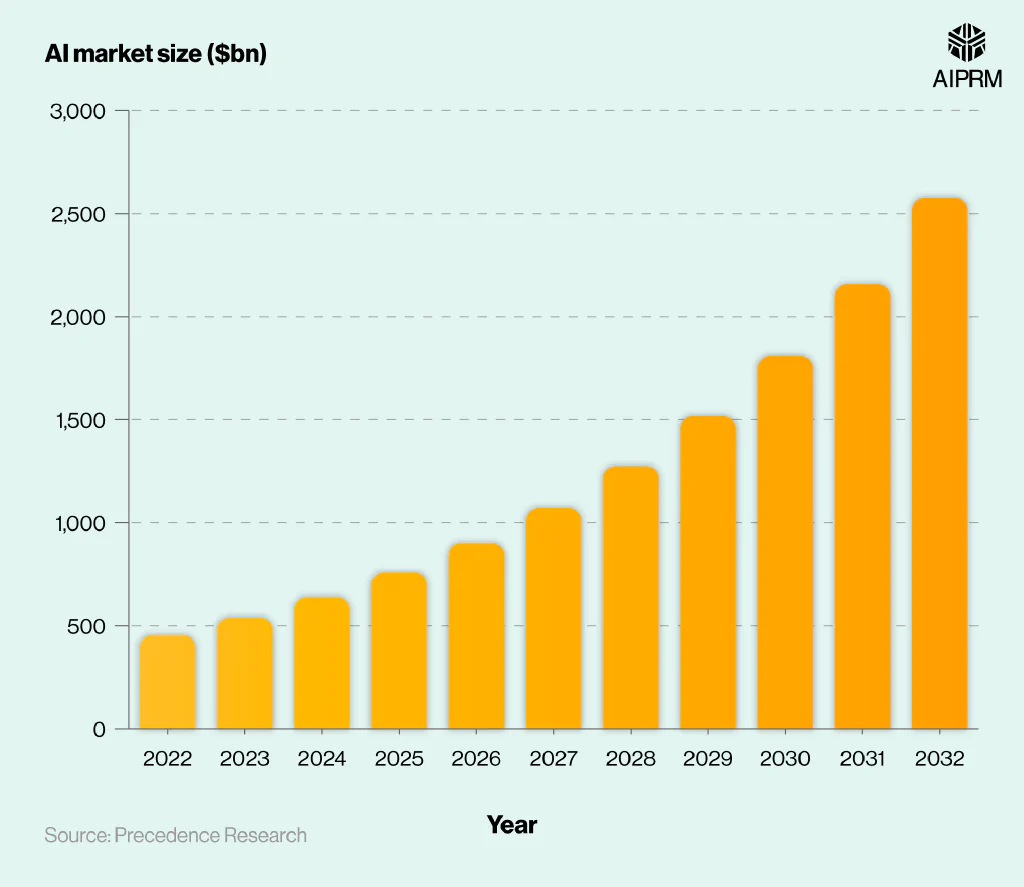
Between 2022 and 2023, the global AI market size grew by around $84bn (+18.5%) and is forecast to grow by over $100bn by 2024.
A breakdown of AI growth statistics in the U.S. between 2022 and 2032 #
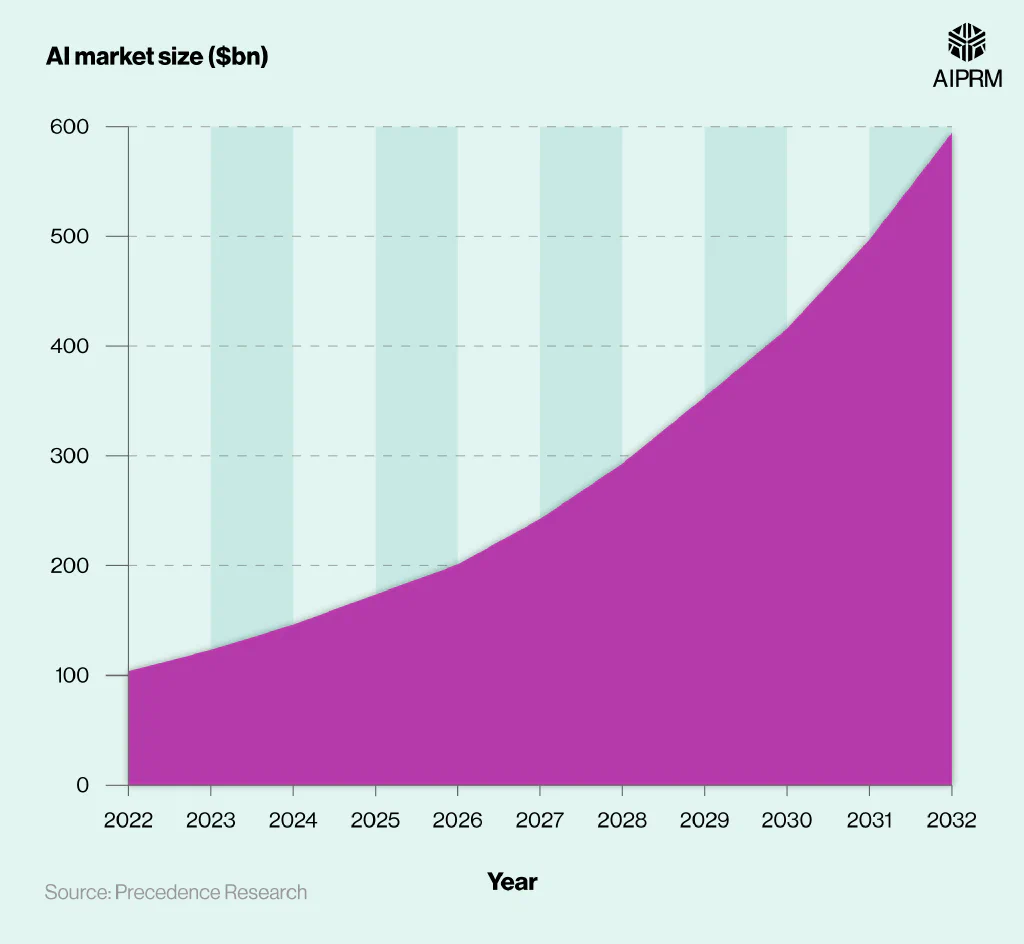
AI growth statistics suggest that the U.S. artificial intelligence market could reach $594bn by 2032, growing at a CAGR of +19.1% during this time.
Between 2022 and 2023, the U.S. AI market size expanded by $19.4bn (+18.7%) and is predicted to reach $146.1bn by the end of 2024. This is a further increase of $23bn.
AI usage statistics by individuals #
With the AI market share increasing over the years, so has the day-to-day usage. Here are statistics on how individuals across demographic groups interact with and implement AI technologies in their personal and professional lives.
How many people use AI? #
A survey of more than 11,000 Americans by Pew Research found that more than half (55%) regularly interact with AI, with a fairly even split between several times a day (27%) or once a day/several times a week (28%).
This leaves 44% of U.S. adults who believe they don’t regularly interact with AI.
Most common uses of AI (exclusive data) #
In December 2023, we conducted a survey of 6,000 people across the U.S. to help discover people’s familiarity, usage, and application of AI, both inside and outside of work.
According to our survey, the most common use of AI in the workplace was using email spam filters, with almost four in every five people (78.5%) claiming to use this form of AI within their job.
This was followed by using chatbots to answer customer service questions, accounting for around three in five (62.2%) workers.
Incidentally, no-one reported using either forms of these AI for personal use.
A breakdown of the most common uses of AI in the workplace and at home #
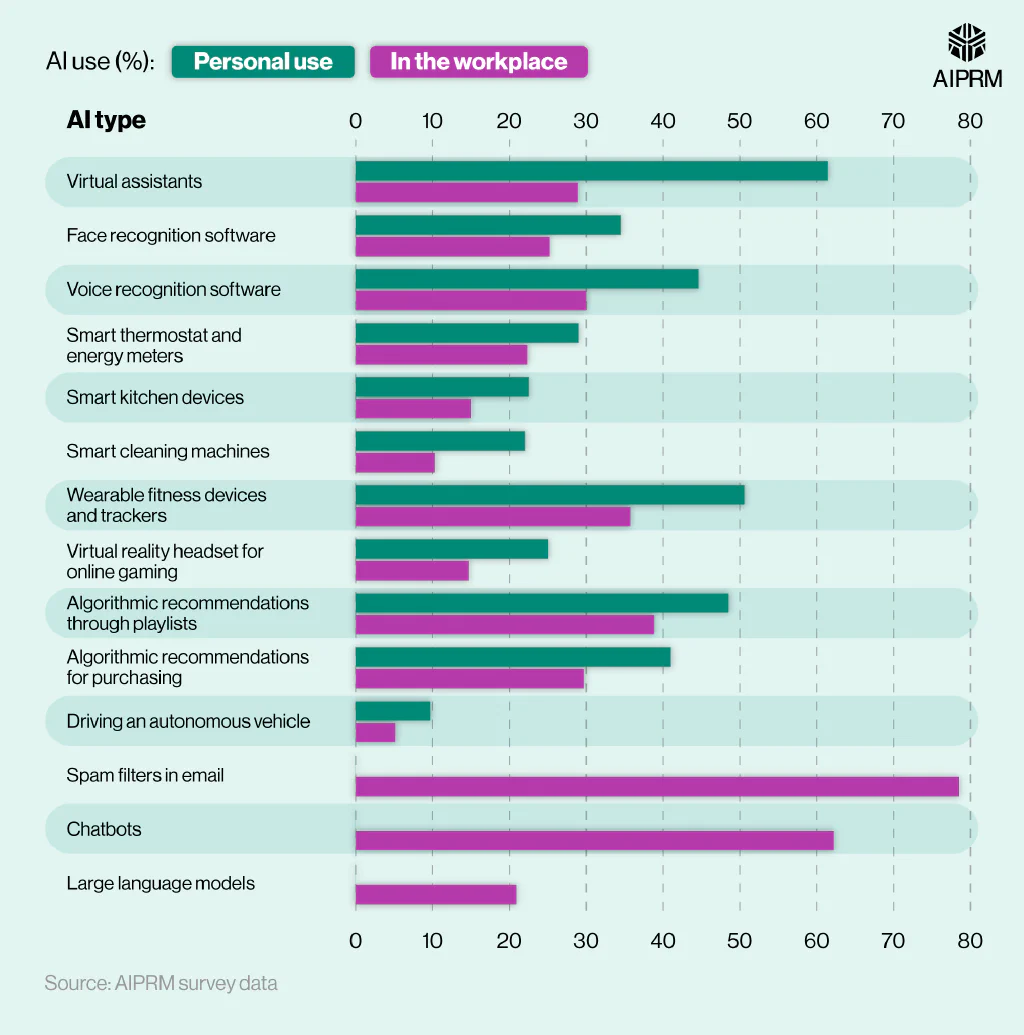
The most popular use of AI for personal reasons was virtual assistants, such as Alexa and Siri. Around three in five people (61.4%) claimed to use this form of AI outside of work, compared to less than one in three (28.9%) in the workplace.
Approximately half (50.6%) of people questioned claim to use wearable fitness devices and trackers outside work, compared to just over a third (35.7%) inside work. Similar stats were reported for algorithmic recommendations through playlists (48.5% vs 38.8%, respectively).
Furthermore, according to AI stats from a consumer survey by Forbes, the majority of people intend to use AI to either respond to people via text or email (45%) or answer financial questions (43%).
A breakdown of the most common uses of AI by consumers #
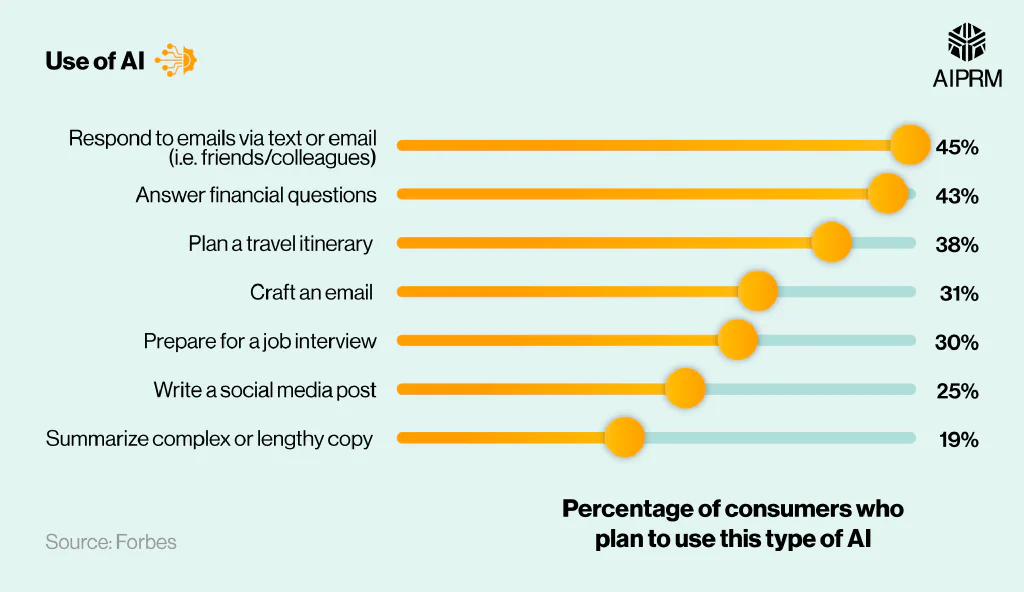
Less than two in five (38%) consumers plan to use AI for planning travel itineraries, with around a quarter intending to use AI to help with social media strategies. This is 6% more than the next usage of summarizing complex or lengthy copy, where 19% of people plan to use this type of AI technology.
With around 243 million Americans expected to be using social media by 2025, and over half (55%) of shoppers learning about new brands on these platforms, it’s no surprise that an effective social media strategy is key to business success – something which AI is perfectly placed to assist with.
How often do people use AI? (exclusive data) #
According to our AI survey of 6,000 U.S. adults, the most common use of artificial intelligence on a daily basis is email spam filters, with around one in three people (29.5%) claiming to use this every day. This is followed with around one in five people who admit to using virtual assistants (such as Alexa and Siri) and algorithmic recommendations through playlists (19.3% and 18.2%, respectively).
On a weekly basis, statistics from our AI survey reveal virtual assistants are the most popular, used by 27.5% of people. This was followed closely by algorithmic recommendations through playlists (26.8%) and email spam filters (26.3%).
Virtual assistants continue to be the most popular on a monthly basis, with around a quarter (24.1%) of people surveyed claiming to use these AI tools once a month. This was followed by wearable fitness devices and trackers, accounting for monthly use in around one in four cases (23.4%). Incidentally, around one in five people (21.9%) reported using voice recognition software at least once a month.
A breakdown of how often people use different types of AI #
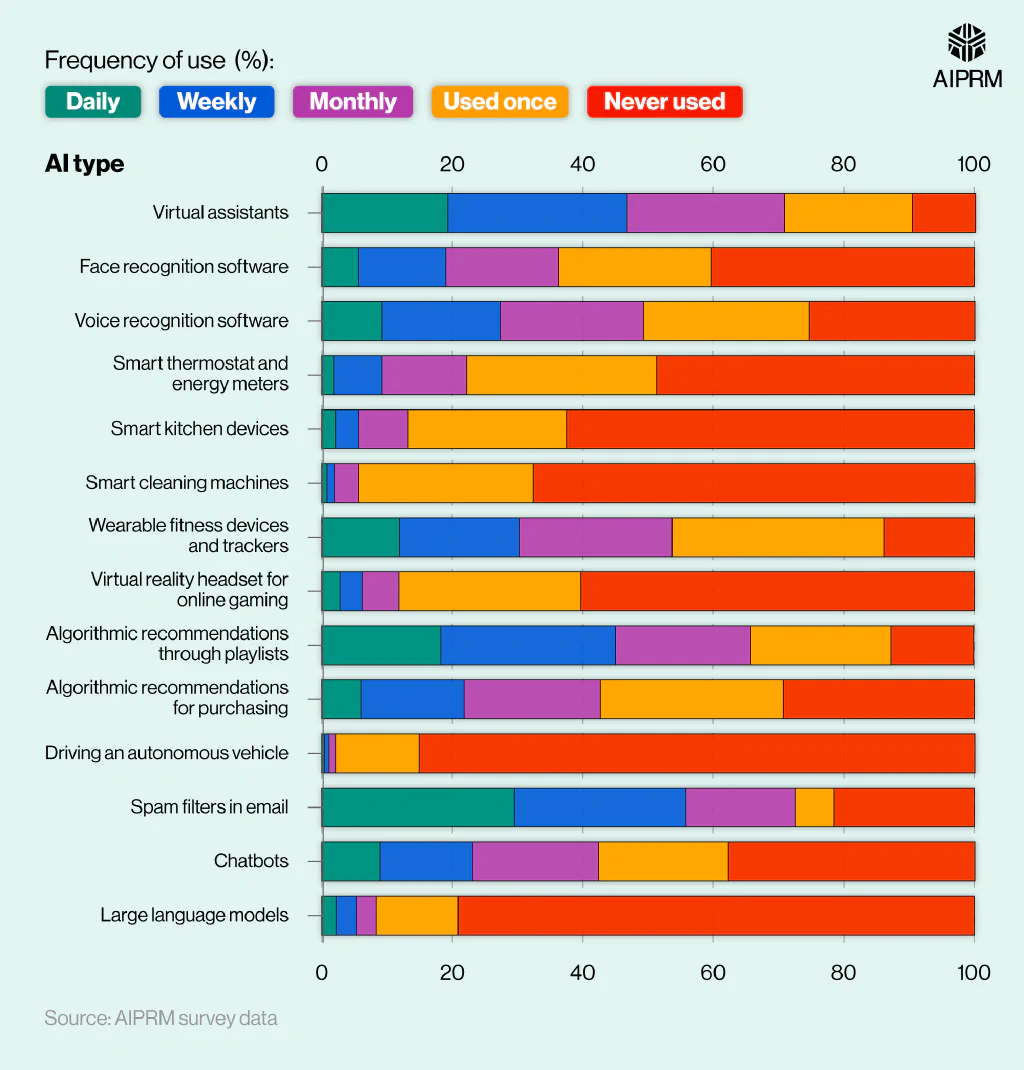
According to AI statistics from our survey, some types of artificial intelligence on the list provided had only been used once by respondents. Around a third (32.5%) of respondents had tried a wearable fitness device/tracker – 3.4% greater than the next most popular for this category (smart thermostat and energy meters).
More than one in four people had also tried using algorithmic recommendations for purchasing (28%), as well as virtual reality headsets for online gaming (27.9%).
Unsurprisingly, 85.2% of people surveyed said they were yet to drive an autonomous vehicle, with just 0.4% claiming to use a driverless vehicle on a daily basis. This was followed by around four in five people (79.1%) who were yet to use large language models (such as ChatGPT and Jasper). Incidentally, around one in 10 (12.6%) had used this form of AI before, with 2.2% on a daily basis.
Who uses AI the most? (exclusive data) #
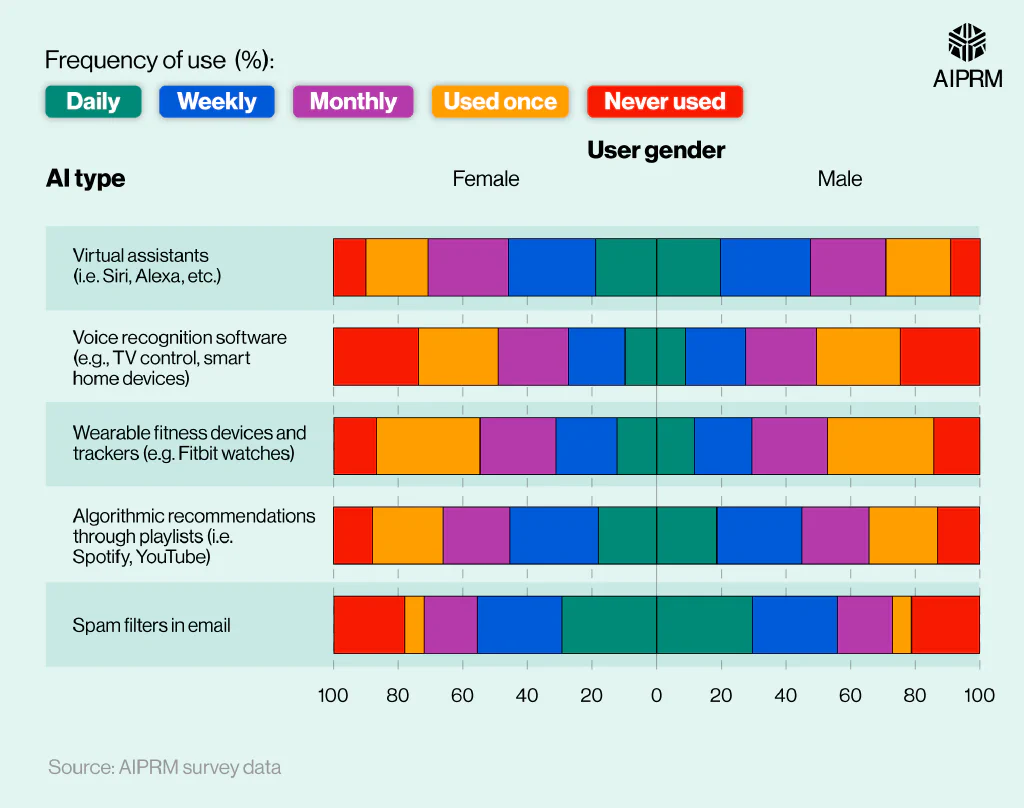
When looking at AI usage statistics by gender, there is very little between the male and female respondents. On a daily basis, around one in three people use email spam filters – the most common use of AI – according to our study. Spam filters are used slightly more by males than females (29.7% vs 29.2%, respectively).
This pattern is also replicated in the next most popular use of AI – virtual assistants – which is used by around one in five people on a daily basis (19.7% vs 18.8% in favour of males).
When assessing weekly AI usage statistics, algorithmic recommendations for playlists was the most common use of AI in females (27.4%) – around 0.5% less than the most common for males on a weekly basis, which was virtual assistants.
On a monthly basis, females tend to use AI more than males. This is shown by around one in four females opting to use either virtual assistants or wearable fitness trackers at least once per month (24.9% vs 23.5%, respectively). By slight contrast, males were equally likely to use these forms of AI on a monthly basis – both on 23.3% of occasions.
A breakdown of AI usage statistics by gender #
In terms of AI that people have only used once, around one in three people surveyed had used a fitness tracking device on one occasion, with the figure slightly more for males (32.9% vs 32.1%, respectively).
Less than one in three females (29.1%) had used algorithmic recommendations for shopping on one occasion compared to around one in five (26.7%) males. Males were more likely to only use smart thermostats and energy meters once (29%) – a figure matched by the female population in our study.
According to the AI statistics from our survey, women were slightly more likely to have never driven an autonomous vehicle (85.6% vs 84.7%, respectively). This pattern was replicated in the use of large language models (79.4% vs 78.9%) and smart cleaning machines (67.9% vs 67.5%), suggesting overall that males perhaps tend to use AI slightly more often than females.
AI usage statistics across age groups show the most common use for AI on a weekly basis is virtual assistants. Those over 61 occupy the largest percentage (30.8%) followed closely by the 18-25 age bracket (29.9%). Similarly, around a quarter (25.3%) of those aged 26-40 admit to using virtual assistants each week.
Another popular use of AI for the 18-25s and over 61s is email spam filters, with around one in three (30.7%) of each group using this form of AI on a daily basis.
For those aged 41-60, wearing fitness trackers daily is a popular option (13.3%) compared to other age groups, such as 10.7% for those aged 61 and over. However, on a weekly basis, it’s the 18-25s who typically use this type of AI more, rising to around one in five (21.1%). As age increases, the percentage who use wearable fitness devices decreases, falling by 3.5% for the 61 and over age group.
A similar trend is observed when it comes to the use of facial recognition software. Around 6.2% of 18-25s admit to using this on a weekly basis, which drops by 0.8% for those 61 and over.
A breakdown of AI usage statistics by age group #
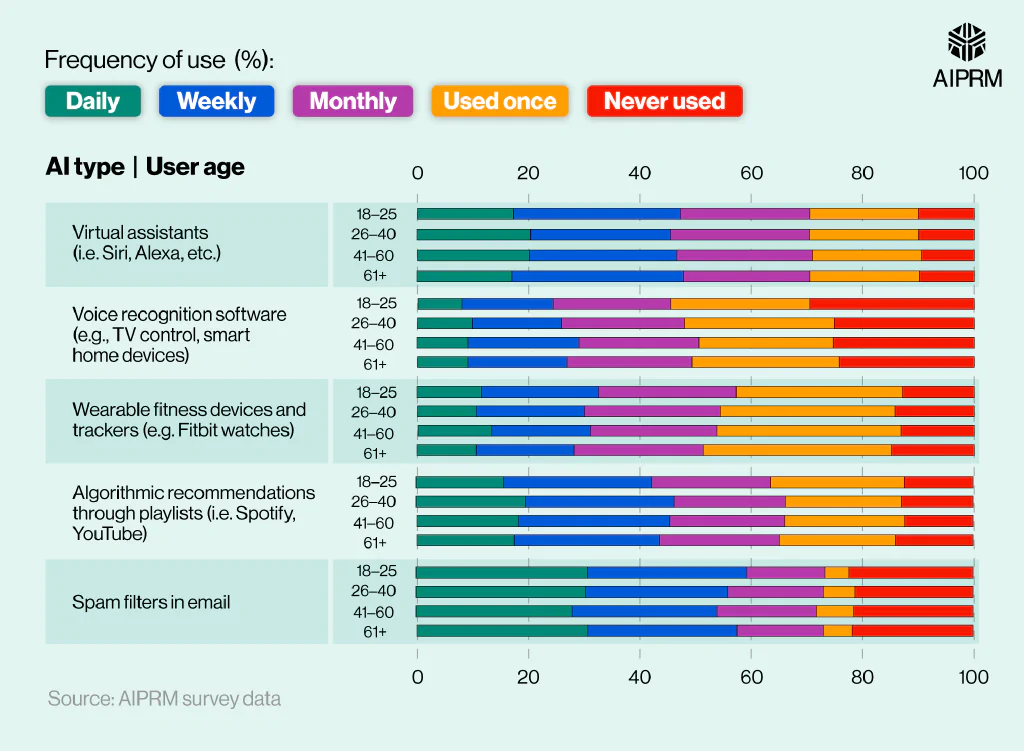
Conversely, the percentage of people using smart thermostats and energy meters follows an opposite trend and gradually increases with age, rising from 5.7% for the 18-25s to 8.2% for the 41-60 year olds.
In terms of types of AI never used, there are few differences between the age groups. Surprisingly just over four in five (81.9%) of those between 18-25 have never used large language models (such as ChatGPT and Jasper). The figure gradually drops with age, down to just over three in four (77.7%) for those aged 61 and over.
Alternatively, around 13.1% of those 61 and above admit to using large language models once, which dropped by 2.4% for the 18-25 year olds.
AI usage statistics in business #
According to our survey, email spam filters are the most common use of AI across different industries. In most cases, around three-quarters of U.S. workers use this form of AI, ranging from 74.8% in the transportation industry up to around four in five (81.1%) from the world of finance and insurance.
Wearable fitness devices tends to be the next most popular form of AI across businesses. More than two in five (43.8%) of those who work in real estate claim to wear this type of AI, with the figure dropping more than 13% for those in transport and warehousing (30.2%).
AI stats from our survey also indicate that algorithmic recommendations through playlists is equally as common, yet with a smaller gap between the highest and lowest reported figures. Around two in five (42.1%) of those working in the information industry use this form of AI, compared to more than a third (36.3%) for those in administrative roles.
The use of ChatGPT in business #
Released in November 2022, ChatGPT is a conversational large language model (LLM), developed by OpenAI. Its user base, as of August 2023, stood at 180.5 million.
According to a survey by Forbes, around two-thirds (65%) of CEOs surveyed plan to use ChatGPT for business purposes instead of search engines. The overwhelming majority (97%) believe this will have a positive impact on their business operations.
Just getting started? Check out our beginner’s guide to ChatGPT to find out what it is, how it can be used, and examples of best practices. Alternatively, our Getting Started with ChatGPT tutorial will help you to get signed up.
A breakdown of AI usage statistics and the potential benefits of ChatGPT for businesses #
| The potential benefit of AI | Percentage of business owners who expect this to happen to their company |
|---|---|
| Generate responses to customers (i.e. chatbots) | 74% |
| Generate content quicker | 70% |
| Create a personalized experience for customers | 58% |
| Increase web traffic | 57% |
| Streamline job processes | 53% |
| Summarize information | 53% |
| Improve decision-making | 50% |
| Improve business credibility | 47% |
| Translate information | 47% |
| Generate responses to colleagues (i.e. emails) | 46% |
| Create content in different languages | 44% |
| Fix coding errors | 41% |
| Generate website copy | 30% |
(Source: Forbes)
Almost three-quarters (74%) of business owners think ChatGPT will help them generate responses to customers through the use of chatbots. However, 58% believe it will create a personalized experience for their customers.
Seven in 10 (70%) CEOs claim this AI tool will help create content quicker, but just over two-fifths (44%) think it will be able to create this content in different languages.
As of 2023, around two in five businesses (40%) already hire people to write for them. With around a third (30%) of business owners expecting the use of AI to write website copy to bring a benefit to their company, it’s easy to see why companies are turning to this technology to help save time and reduce costs.
Check out our testimonials to see how hundreds of business owners have already benefited from the use of AIPRM’s products and services from the AI prompt marketplace.
Public perceptions of AI #
A survey by Pew Research indicates that just 15% of adults are more excited than concerned when it comes to interacting with AI, compared to 38% for the reverse.
And, with more than three-quarters (77%) of people surveyed by Forbes also worried that AI will lead to job losses over the coming year, it’s understandable to see why public perceptions of AI are mixed.
Other key AI statistics from the survey found that:
-
Over three-quarters (76%) were worried about misinformation from AI tools.
-
More than half (54%) could tell the difference between human and AI-generated content.
-
Around two in three (67%) people would use ChatGPT instead of Google.
-
Consumers are most concerned about businesses using AI to write product descriptions (70%).
That said, almost two-thirds (65%) of those surveyed said they would still trust businesses that use AI technology, with more than half (54%) claiming it could improve the customer experience from a content perspective.
In addition, over half (55%) of people admitted they would be comfortable with AI analyzing their social media usage to provide a more personalized experience online and create more engaging social media posts.
Public perceptions on the benefits of AI (exclusive data) #
According to the results from our survey, around two in five (43.1%) people believe AI will increase productivity, with slightly less (39.4%) thinking the use of artificial intelligence will enhance decision-making.
A breakdown of the perceived benefits of AI by the U.S. public #
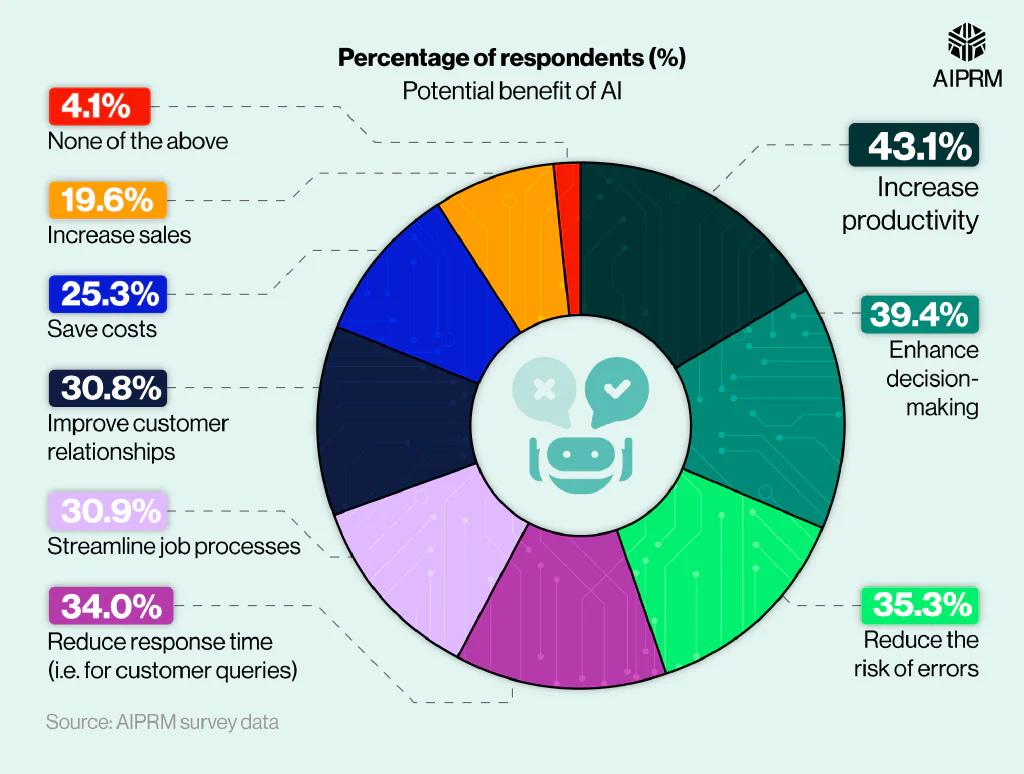
More than a third (34%) of those surveyed said AI should reduce response times for customer queries, with around a quarter (25.3%) claiming AI could be used to help save costs.
On the other hand, less than one in 20 respondents (4.1%) believe AI will have no benefits.
A breakdown of the perceived potential drawback of AI by the U.S. public #
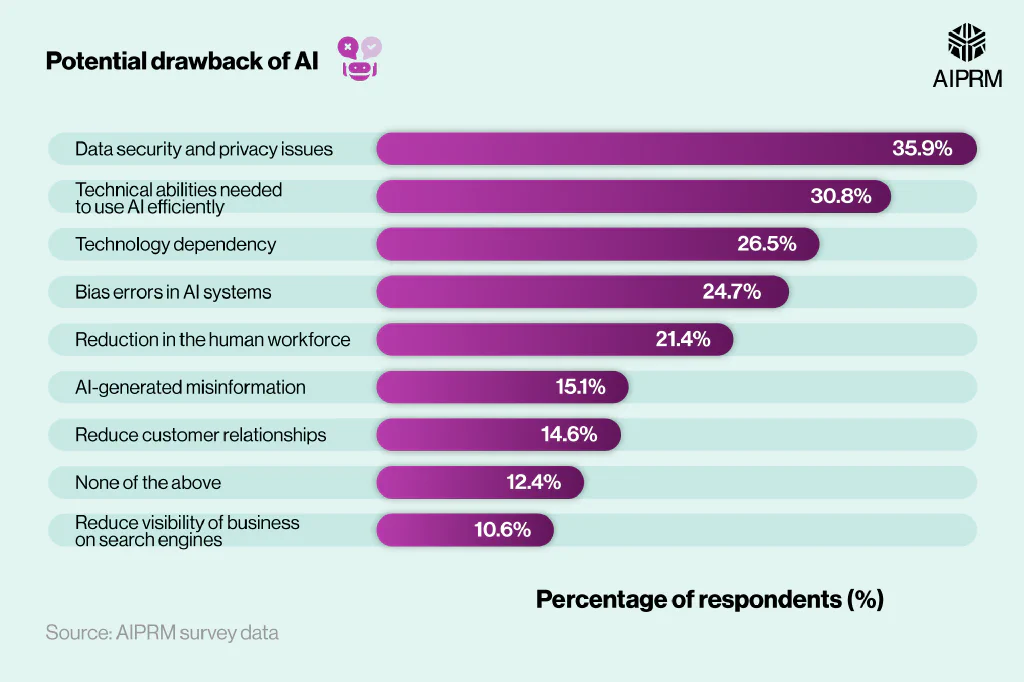
AI statistics from our survey reveal that people are most concerned about data security and privacy issues when it comes to AI. More than a third (35.9%) of those questioned stated this as a potential drawback of artificial intelligence.
Less than one in three (30.8%) claim that needing technical abilities to use AI efficiently was a potential negative, followed by just over a quarter (26.5%) who think AI will lead to a technology dependency.
In all, more than one in 10 (12.4%) believe AI will not have any potential drawbacks – three times more than those who think it will have no positives.
Public perceptions of AI in healthcare #
According to another study by Pew Research, around two in five (39%) adults are comfortable with healthcare providers using AI in their healthcare procedures, with a similar proportion (38%) believing AI could improve healthcare outcomes.
Interestingly, a third (33%) thought AI would make it worse, with just over a quarter (27%) claiming it would make no noticeable difference.
Pew Research also found that two in five (40%) adults believe AI would reduce errors in healthcare (as opposed to increase), with over half (51%) thinking AI will reduce incidences of racial and ethnic bias.
A breakdown of public perception of AI in the healthcare sector #
| AI technology is moving too slowly and missing opportunities to improve patients’ health | AI technology is moving too fast before fully understanding the risks to patients | |
|---|---|---|
| U.S. adults (overall) | 23% | 75% |
| A lot | 29% | 70% |
| A little | 22% | 77% |
| Nothing | 21% | 75% |
(Source: Pew Research)
*Respondents who didn’t provide an answer are not shown in the data
According to a 2022 survey by Pew Research, around three-quarters (75%) of U.S. adults believe AI technology is moving too fast in healthcare and being used before fully understanding the risks.
Interestingly, less than a third (29%) of U.S. adults think that the implementation of AI technology in healthcare is moving a lot slower than they would like.
Public perceptions of AI in education #
A 2023 experiment by Rask, which involved exposing 300 audience members to a mixture of AI-generated and human-created learning videos, found that 90% did not express signs of negativity towards video synthesis with AI.
In addition, more than two-thirds (67%) of participants didn’t mention the difference between AI and non-AI-generated content in their feedback.
Audience engagement between AI-generated and human-created learning videos was also identical, with findings supported by students at Cornell University in a similar study.
Research by Junior Achievement suggests that students want to know more about AI, with nine in 10 stating they would be interested in learning about artificial intelligence in high school and how to work with it. Yet, only one in 10 teachers surveyed admitted to knowing enough about the basics of AI to teach about it or use it in their work.
For more information, check out our blog on ChatGPT for college students and how it can help their research, planning, writing, and studying.
A breakdown of how important educators think it is to teach students about AI #
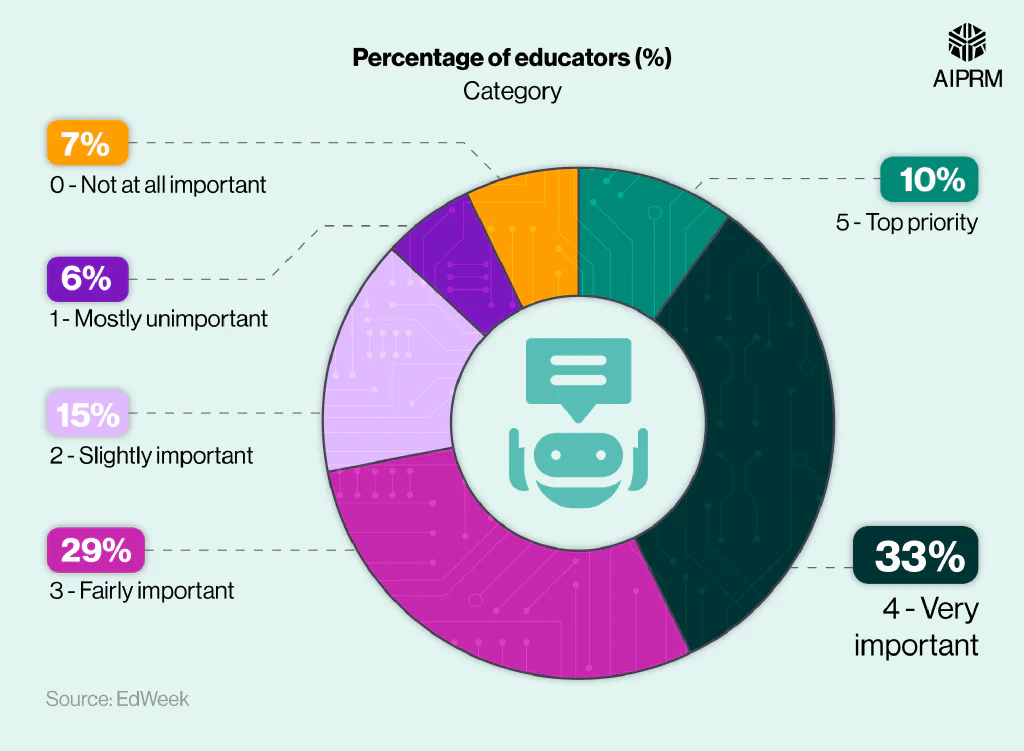
According to an EdWeek Research Centre survey from June 2023, one in 10 educators believe teaching students about AI should be a top priority for schools, with a third (33%) claiming it’s very important to do so.
Only 13% of educators believe it’s mostly unimportant or not at all important to teach their students about AI technologies, lower than any other option in the survey.
A breakdown of how knowledgeable educators feel about AI #
| Perception | Percentage of educators |
|---|---|
| I know each to understand it at a basic level myself, but I’ve never used it | 42% |
| I’ve heard of it, but that’s about it | 21% |
| I’ve used it and understand it at a basic level, but I don’t know enough about it to use it for my job | 15% |
| I know enough to teach or use some of the basics at work, but not much beyond that | 10% |
| I know each to teach about some key pieces the applications, potential bias problems, and basic technical aspects and/or use it at work | 7% |
| I’ve used it at least once but don’t understand it | 3% |
| This is the first I’ve heard of it | 2% |
| I’m an expert at teaching about and/or using it at work | 0% |
(Source: EdWeek)
Around two in five (42%) U.S. educators claim to have a basic understanding of AI but have never used it, with one in five (21%) having heard of it but know no more.
Incidentally, no educators from the survey claimed to be AI experts, either in their teaching or using it at work. However, only 2% answered that this was the first they’d heard of it.
A breakdown of how much professional development educators have received about AI training #
| Amount of AI training received | Percentage of educators |
|---|---|
| A lot | 0% |
| Some | 3% |
| A little | 10% |
| None | 87% |
(Source: EdWeek)
The lack of expertize could be down to an absence of training. Of those educators surveyed by EdWeek, the overwhelming majority (87%) claimed to have received no AI training as part of their professional development, with around one in 10 stating they have had a little bit of training on the teaching of AI.
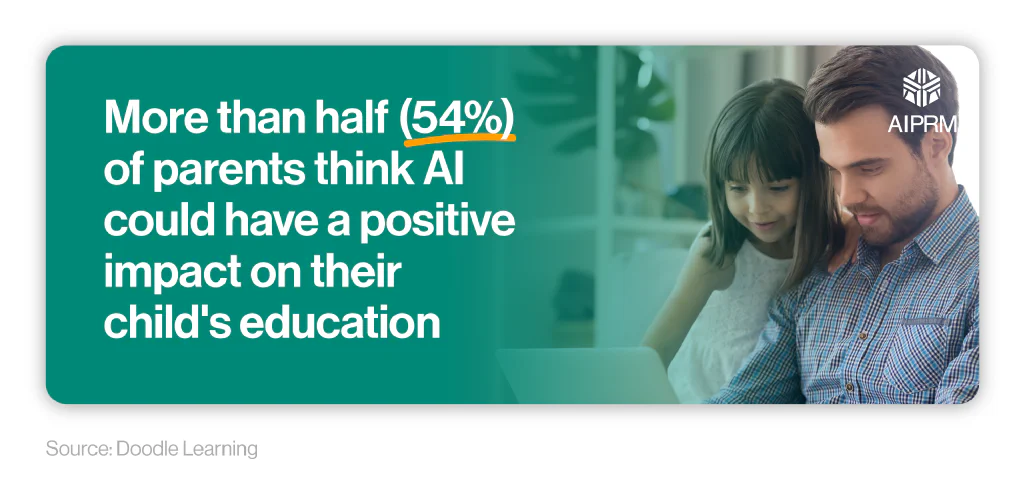
A breakdown of parental perception of AI in education #
According to research by Doodle Learning, just over half (54%) believe AI could potentially have a positive impact on their child’s education, with around a third (35%) remaining unsure.
That said, around four in five (80%) parents have expressed concerns about the harmful effects AI could have on children’s education. Primary parental concerns with AI are centered around privacy/data (59%), and the accuracy and reliability of AI-generated content (49%)
Despite these concerns, just over a third (35%) of parents have discussed AI usage with their children.
Public knowledge and awareness of AI #
According to the results from our AI survey, more than half (54%) of people in the U.S. are ‘somewhat familiar’ with artificial intelligence and know a little bit about it.
A breakdown of how familiar the U.S. public are with AI #
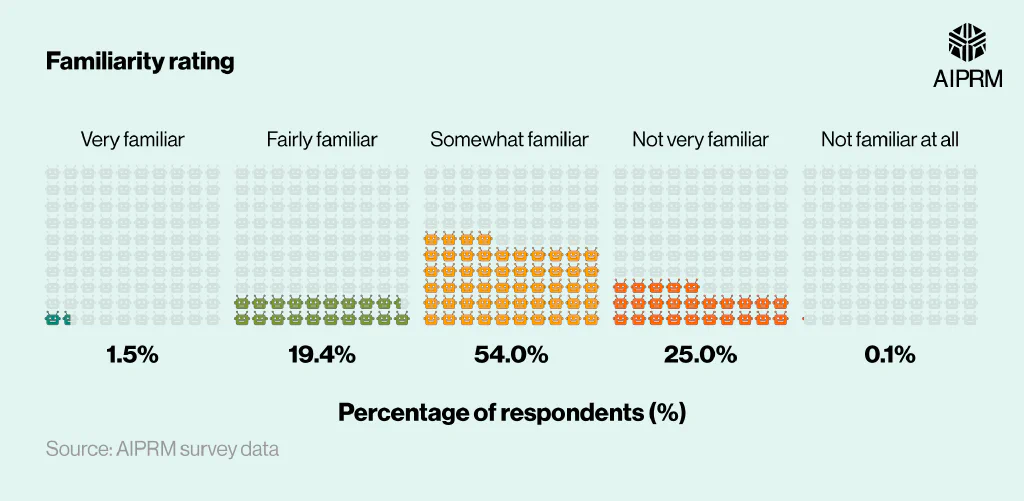
| Familiarity rating | Percentage of respondents (%) |
|---|---|
| 1. Very familiar (I confidently know what they are) | 1.5% |
| 2. Fairly familiar (I know what they are) | 19.4% |
| 3. Somewhat familiar (I know a little bit about them) | 54.0% |
| 4. Not very familiar (I have heard of them, but not really sure what they are) | 25.0% |
| 5. Not familiar at all (I have never heard of them) | 0.1% |
(Source: AIPRM survey data)
Almost a fifth (19.4%) of those surveyed admit to being ‘fairly familiar’ with AI, as opposed to a quarter (25%) who claim to be ’not very familiar’.
AI stats also reveal that people are 15 times more like to be ‘very familiar’ and confident with AI, compared to having never heard of it (i.e. ’not familiar at all’).
Research by KPMG also found that more than two-thirds (68%) of people surveyed commonly used AI-enabled technologies. Yet, only two in five (41%) of these people were aware that these applications used AI to function.
A breakdown of public awareness of AI between different countries #
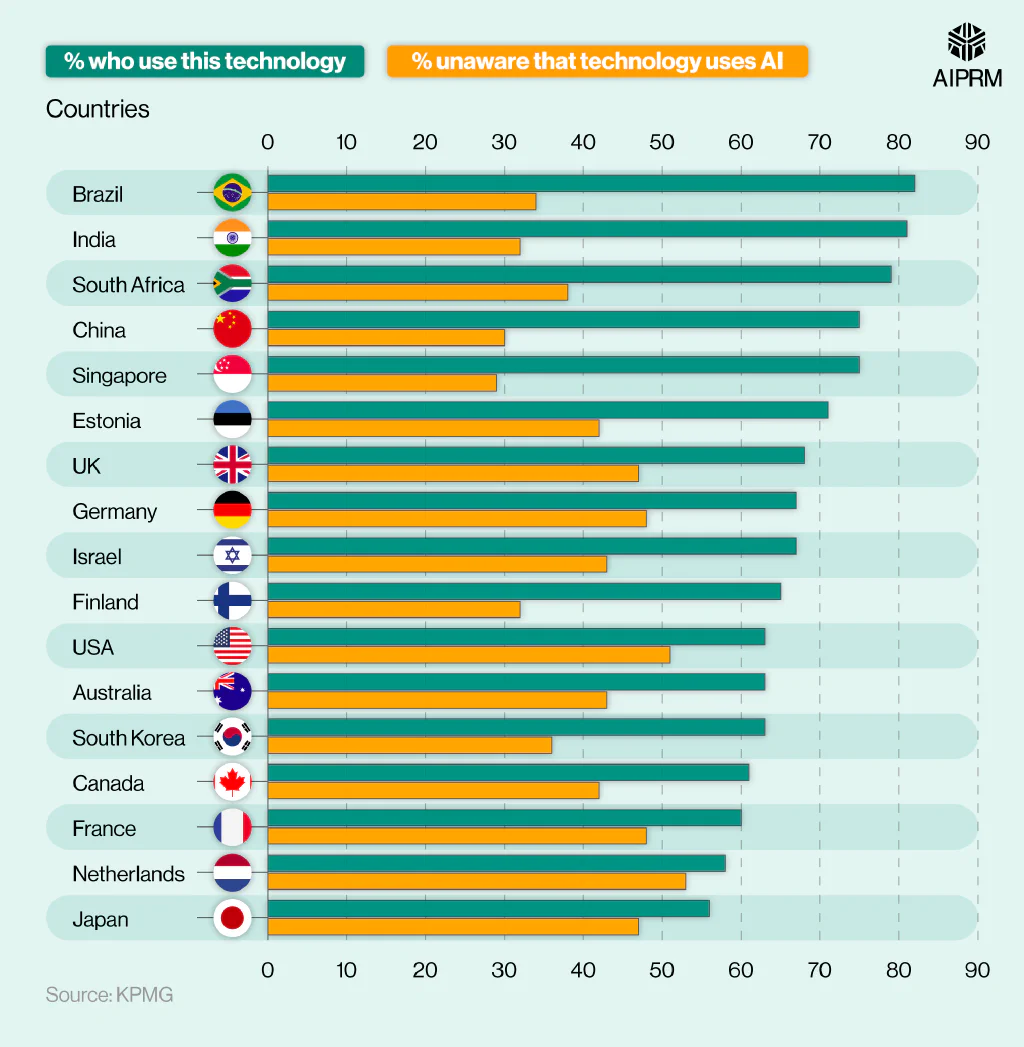
On a country level, Brazil has the greatest number of residents who use AI (82%), followed by India (81%). However, around a third (34% and 32%, respectively) of their populations were aware that the technology they were using relied on AI.
By comparison, around three in five (63%) Americans surveyed stated they use AI technologies, but just over half (51%) were actually aware of this. This was the second-highest figure reported across all countries for AI awareness, marginally behind the Netherlands (53%). Yet, this technology was only used by 58% of the Dutch population.
Coming across any unfamiliar terminology? Check out our ultimate generative AI glossary for definitions of keywords associated with artificial intelligence.
A breakdown of public knowledge of AI between different countries #
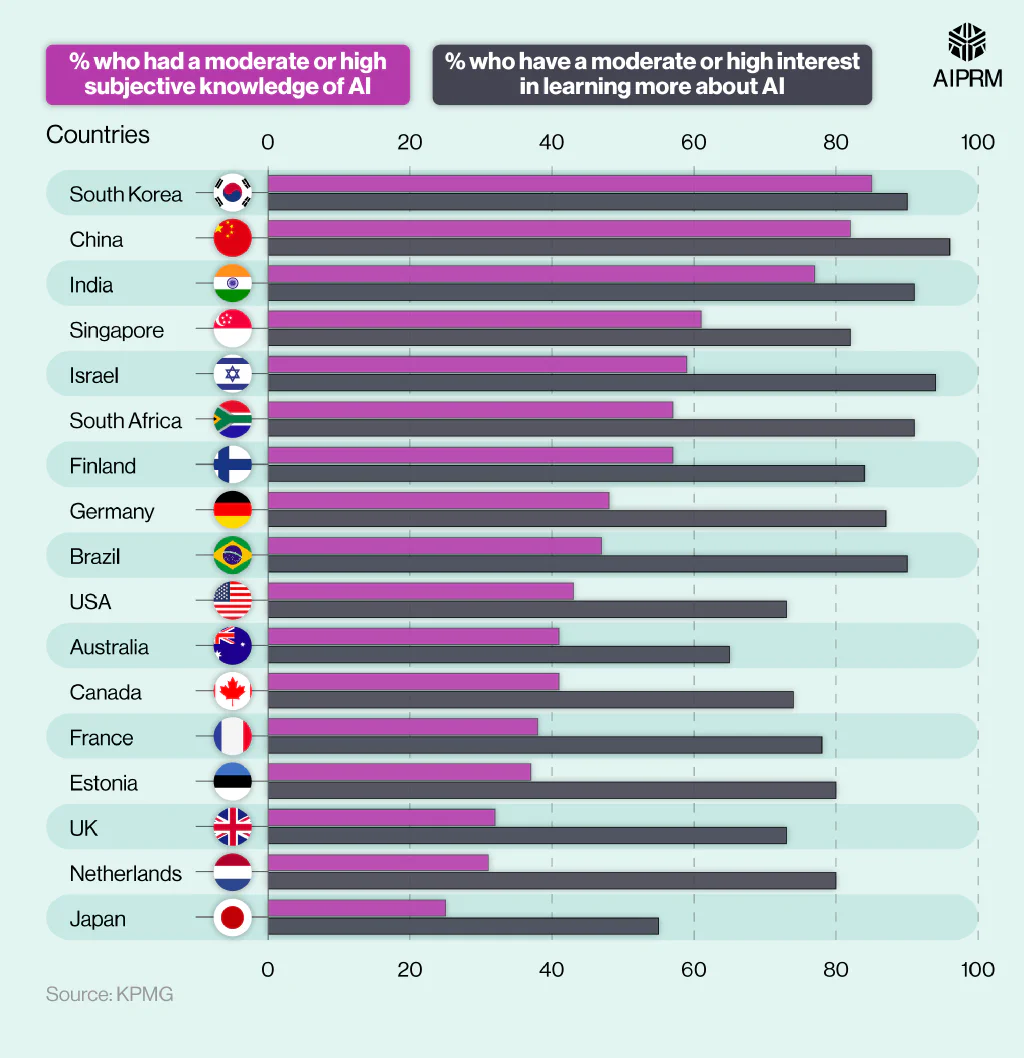
On the whole, Asian countries tend to display greater subjective knowledge of AI, with South Korea and China leading the way (85% and 82%, respectively). Despite this, only a quarter (25%) of Japan’s population have a high or moderate understanding of AI – the lowest reported figure across all countries included in KPMG’s study.
By comparison, AI stats reveal less than half (45%) of Americans feel they have a high or moderate level of AI knowledge, with almost three-quarters (73%) wanting to learn more about AI.
The countries where people have the greatest desire to expand their AI knowledge are China (96%) and Israel (94%). By contrast, just over half (55%) of Japan’s population want to learn more about AI – the lowest reported figure in the study.
A breakdown of public knowledge of AI between different demographic groups #
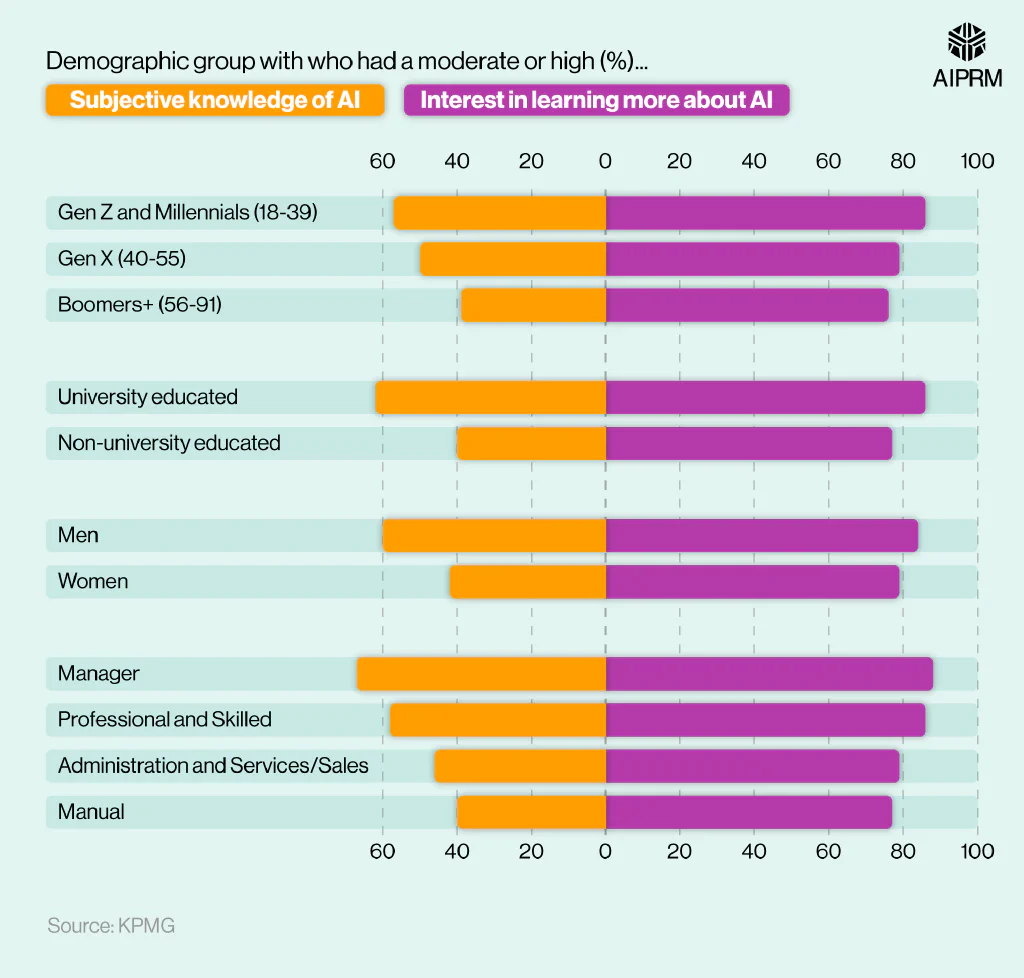
AI statistics reveal that Gen Z and Millenials show a greater level of subjective AI knowledge than their older counterparts. Almost three in five (57%) of those aged 18-39 feel they have a high or moderate level of AI knowledge compared to just 50% of 40 to 55-year-olds and 39% for those over 56.
Gen Z and Millenials are also the most keen to learn more about AI (86%), compared to 79% and 76%, respectively, for the Gen X and Boomers+ generations.
Those with a university education display a third greater knowledge of AI than those who didn’t attend university (62% vs 40%) and have a greater level of enthusiasm to learn more (86% vs 77%).
Men exhibit a higher level of subjective AI knowledge compared to women (60% vs 40%) and a greater desire to learn more about AI (84% vs 79%).
Perceived AI knowledge tends to increase as workers become more skilled/qualified. For example, two in five (40%) manual workers feel they have moderate to high AI knowledge compared to around two-thirds (67%) of managers. The desire to expand AI knowledge also follows a similar pattern, but with figures that are much closer between groups (77% for manual workers compared to 88% for managers).
The topic of public awareness and AI is further explored by Pew Research, which conducted a study involving 11,000 adults to see how many could correctly identify examples of AI in everyday life.
A breakdown of AI public awareness statistics in the U.S #
| Example of AI | Percentage of American adults who could identify this as an example of AI |
|---|---|
| A wearable fitness tracker that analyzes exercise and sleep patterns | 68% |
| A chatbot that immediately answers customer questions | 65% |
| Product recommendations based on previous purchases | 64% |
| A security camera that sends an alert when there is an unrecognized person at the door | 62% |
| A music playlist recommendation | 57% |
| The email service categorizing emails as spam | 51% |
(Source: Pew Research)
According to AI statistics from Pew Research, just over two-thirds (68%) of adults could identify that wearing a fitness tracker was an example of AI in everyday life, with around half (51%) recognizing that an email service categorizing an email as spam was also an example of AI in action.
In all, less than a third (30%) correctly selected all six examples of AI from a designated list, meaning they are defined as having a “high level of AI awareness”. A similar percentage (31%) of U.S. adults are categorized as having a “low level of AI awareness” by correctly identifying two or fewer AI examples from the list.
A breakdown of AI awareness statistics by different demographic groups #
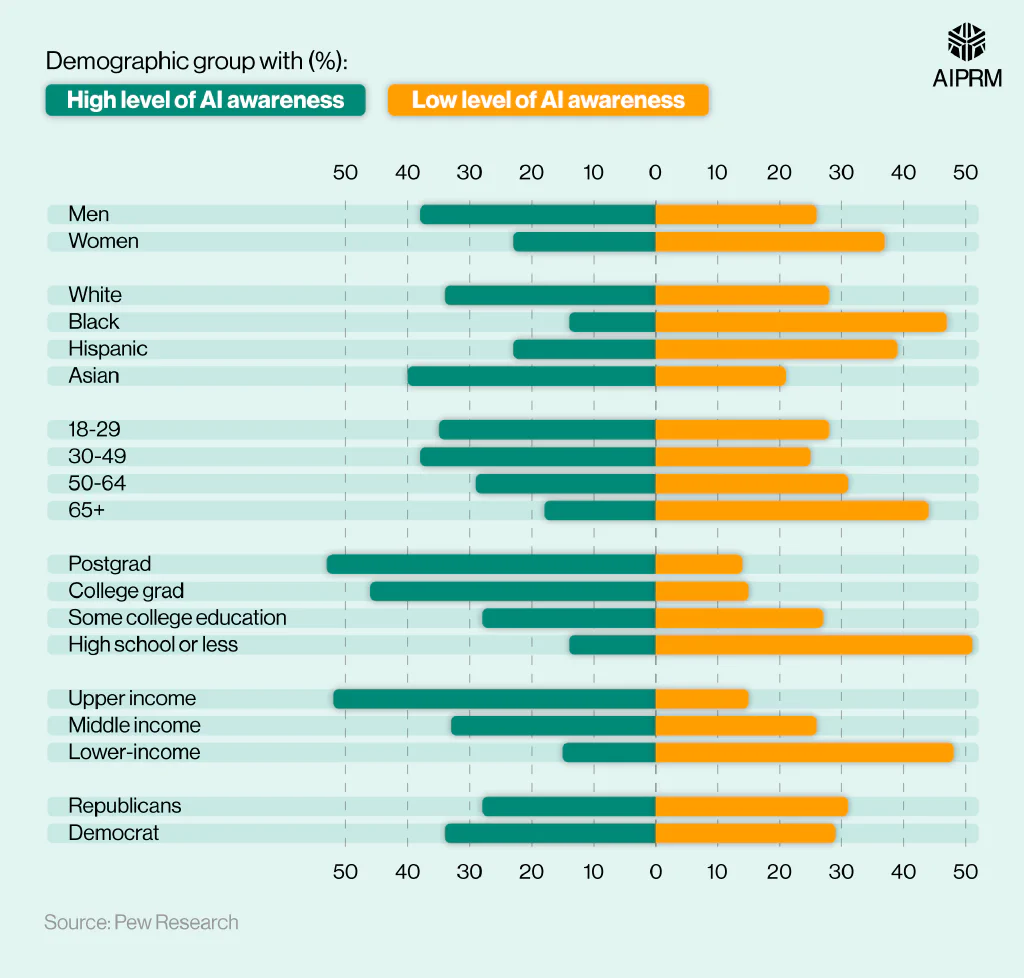
Income seems to be a big factor when it comes to AI awareness. Over half of those in the upper income bracket have a high level of AI awareness, while just 15% of those with a lower income have the same knowledge.
Men tend to have more AI awareness than women, with the numbers standing at 38% versus 23%, respectively.
When broken down by different demographic groups, those with the highest levels of AI awareness tend to be:
-
Asian (40%)
-
Men (38%)
-
Age 30-49 (38%)
-
With a postgraduate qualification (53%)
-
In a high-income job (52%)
-
Democrats (34%).
AI in business statistics #
The varying nature and features of AI mean that they are adaptable to lots of different business scenarios and tasks.
According to a survey by Forbes, the most common use of AI in business is for customer service (56%), followed by cybersecurity and fraud management (51%).
A breakdown of AI usage statistics in business #
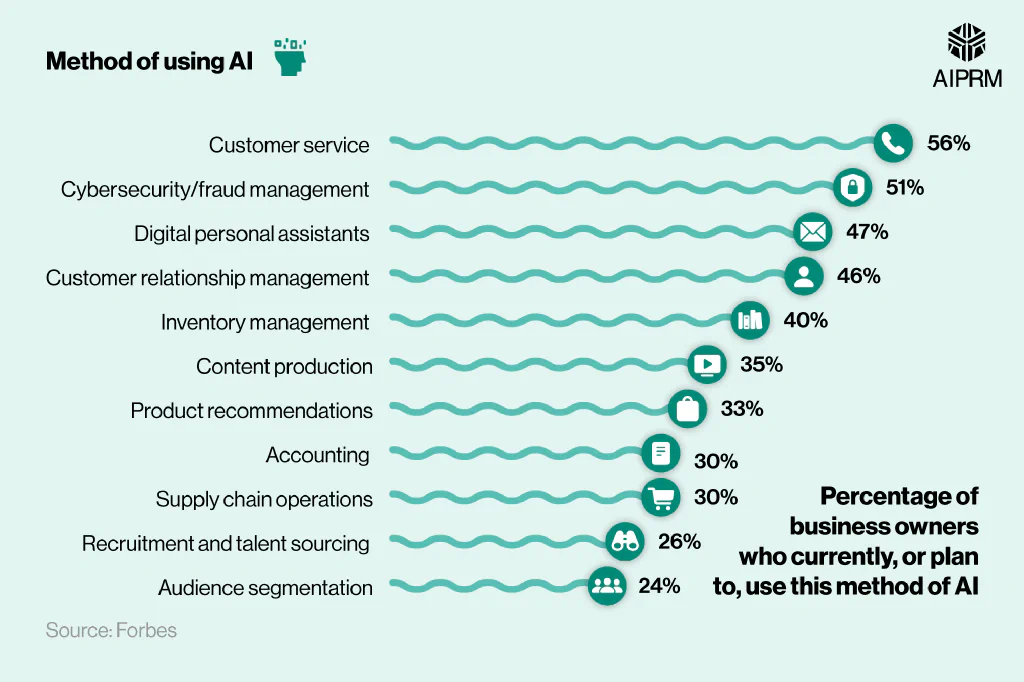
While the use of AI in customer service came out on top, using the technology for customer relationship management was 10% lower, at 46%.
While businesses seem to trust AI for their customers, they are less likely to use it to find their employees. Around a quarter of businesses surveyed currently use, or plan to use, AI for recruitment purposes (26%).
A breakdown of AI usage statistics in business to enhance the customer experience #

Around three-quarters (73%) of business owners currently use AI-powered chatbots for instant messaging, with approximately three in five (61%) using AI to optimize emails.
Over half (55%) of business owners utilize AI for more personalized services, such as product recommendations, with more than a third (35%) also planning to use AI for content production.
Feel free to contact us for your AI business enquiries to explore the opportunities available for AI integration in your company.
A breakdown of AI usage statistics in business to improve internal processes #
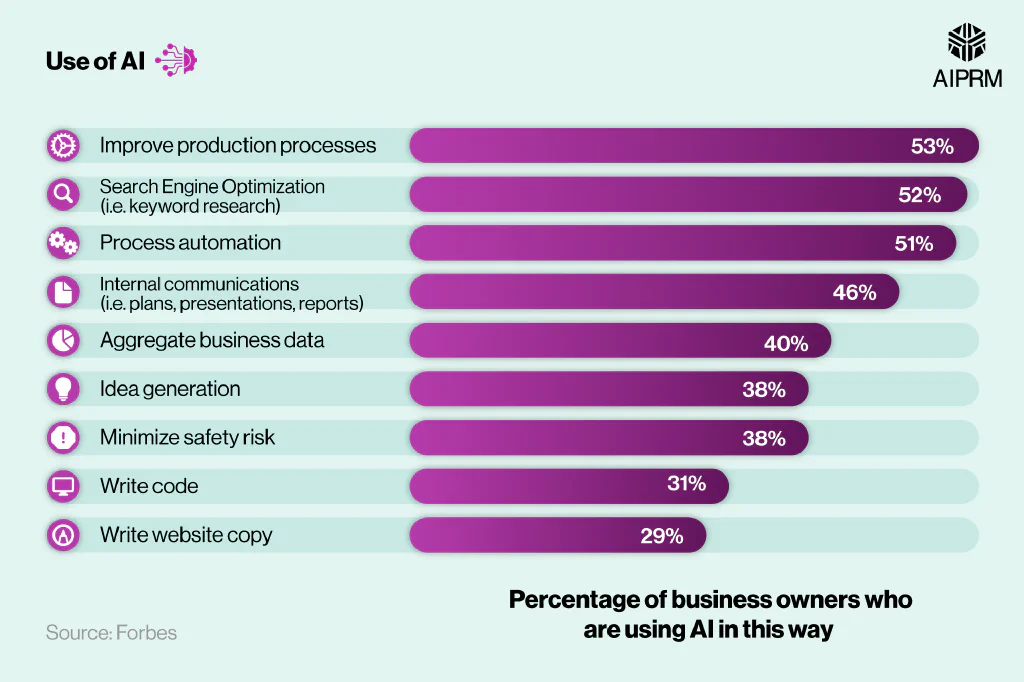
Artificial intelligence statistics from a 2023 Forbes survey found that businesses are using AI to improve internal processes. The most common use of AI for this purpose was to enhance production processes (53%), followed very closely by search engine optimization tasks (52%) and process automation (51%).
Check out our price plans for ChatGPT with AIPRM to see how you can harness the power of AI without breaking the bank.
A breakdown of the benefits of AI in the workplace #
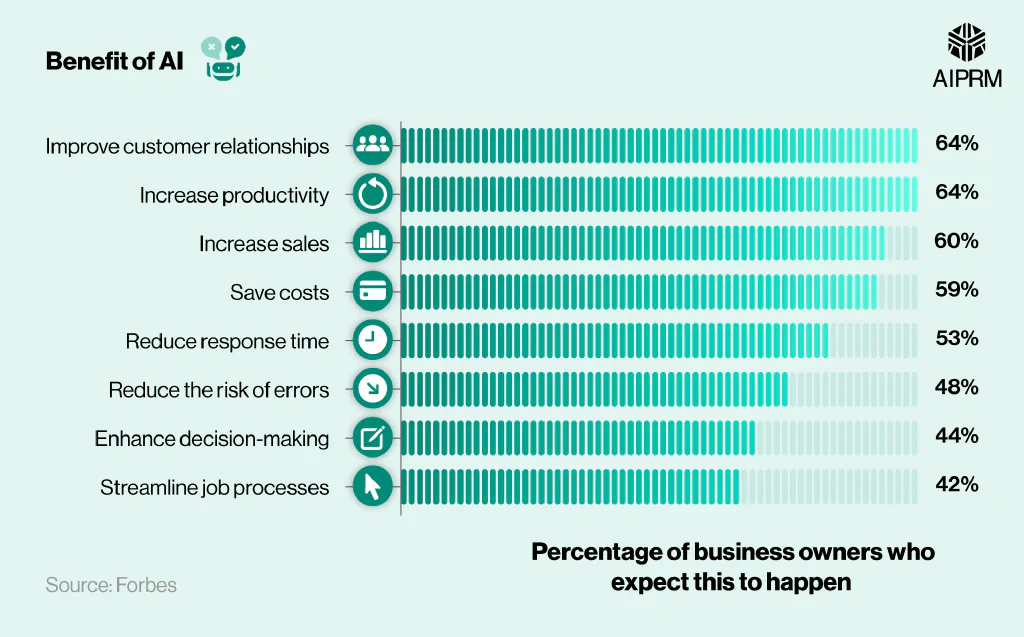
Regarding the benefits of AI in the workplace, around two-thirds (64%) of companies expect using artificial intelligence to improve customer relationships and productivity (64%).
Three out of Five (61%) Marketers are using AI to save time & resources. Marketers are using AI as a trusty tool to assist with natural workflow of content creation, analysing performance and predicting improvements for better engagement.
At the other end of the scale, less than a third (29%) plan to use AI for copywriting and adding content to their website.
A breakdown of the potential drawbacks of AI for businesses #
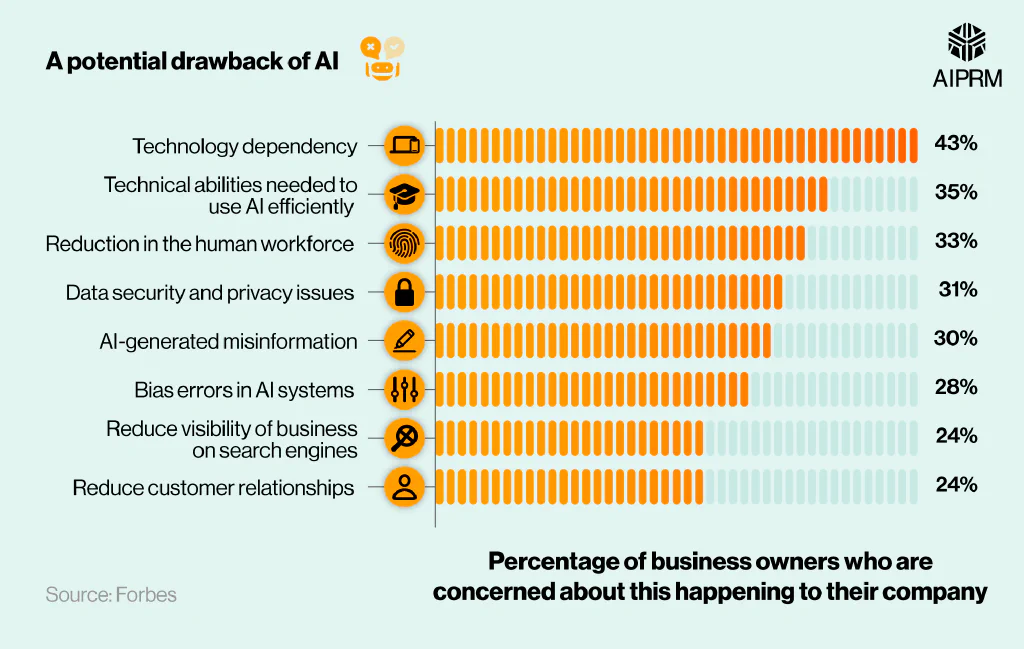
According to AI stats from a Forbes survey, around two in five (43%) business owners are mostly concerned that AI will create a technology dependency within their company.
Just over a third (35%) are worried that they lack the technical abilities to efficiently use AI systems in their business, with one in three business owners stating AI could lead to a reduction in their human workforce.
In line with the previous findings of the benefits of AI, reducing customer relationships was one of the lowest concerns (24%).
Check out our business pricing plans for ChatGPT with AIPRM to see how AI can help benefit your business without costing the world.
AI and SME statistics #
SMEs account for around 99% of all businesses in the U.S. and employ nearly half of the American workforce.
The emergence of AI allows small businesses to use next-generation tools and resources to facilitate sustainable economic growth.
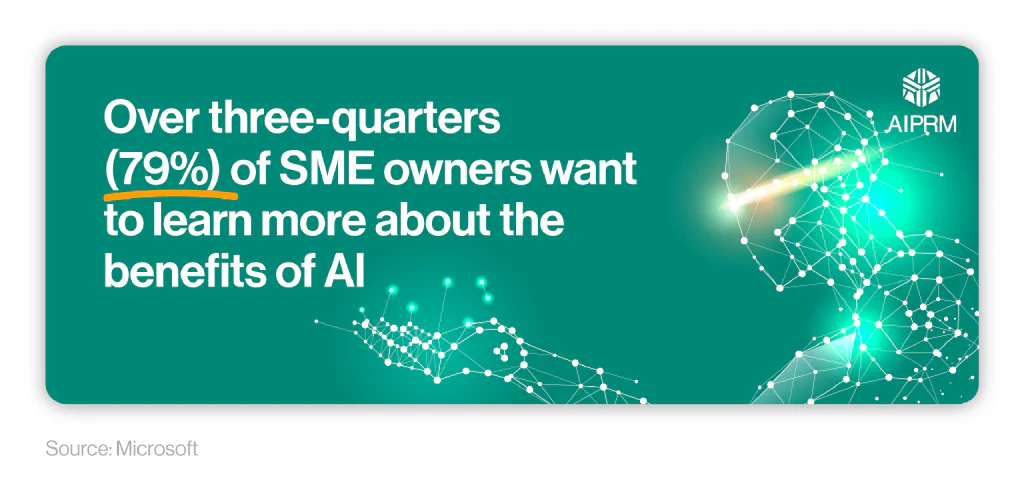
A Microsoft study of 1,000 SMEs found that over three-quarters (79%) of small business owners were interested in learning more about the benefits of AI in the workplace and how it could apply to their companies.
Their study also found that:
-
Almost two-thirds (65%) of small business owners cited inflation as their biggest financial risk, compared to 51% in 2022.
-
Financial stress often leads to tighter budgets, particularly in critical areas. Almost half (49%) of SME owners felt they hadn’t invested enough in data security over the past year, with around two in five (43%) admitting they didn’t have the financial means to prioritize data security.
-
Nearly half (47%) of small business owners feel overwhelmed with the day-to-day aspects of running their business, which ultimately impacts their company’s growth. This figure jumps to 65% for Gen Z small business owners.
Check out our ultimate guide on ChatGPT for small business owners to see how your company could benefit from the implementation of AI, such as ChatGPT.
In the world of SMEs, AI is seen as a potential game-changer, with almost half (47%) of small business owners admitting AI could prove to be a valuable asset for their company. This figure jumps to 71% for Gen Z entrepreneurs and 88% for those who consider themselves AI experts.
More than half (56%) believe AI will increase business efficiency, with the most common areas to benefit being customer data and trends (49%) and automating repetitive tasks, such as tracking and customer service (46%).

That said, Microsoft’s study revealed a knowledge gap that needs to be bridged before AI can be successfully implemented across SMEs and used to its full potential.
Only 10% of SME owners surveyed knew how to use AI for work-related tasks, with more than two-thirds (67%) claiming they knew little to nothing about AI in general.
The most commonly cited reason for not engaging with AI to date was finance/cost (51%).
Check out our guide to effective prompt engineering for small businesses to see how your company could benefit from the implementation of this AI.
Artificial intelligence statistics from another Microsoft study also found that early adopters of technology are four times more likely to be confident in their business. With almost four in five (79%) SME owners expressing an interest in learning more about AI, this looks like a promising financial future for many small business owners.
AI in the public sector statistics #
According to AI stats from the Stanford Law School, early AI intervention was shown to transform government administration tasks in nearly half of the 142 largest federal agencies. However, with just 2% of those with an AI-related PhD taking up a job in government, this poses a challenge for future governance.
In terms of investment, CNAS recommends the U.S. government should increase AI spending in the public sector to $25 billion by 2025, to remain ahead of other nations. Given that AI is expected to contribute a 21% net increase to U.S. GDP by 2030, this would appear to be a sensible and sustainable economic decision.
AI in healthcare statistics #
As of 2023, AI in healthcare is expected to be worth $20.65bn – a rise of $5.5bn (+37%) from the previous year and almost double the respective figure for 2021.
A breakdown of AI in healthcare statistics between 2021 and 2030 #
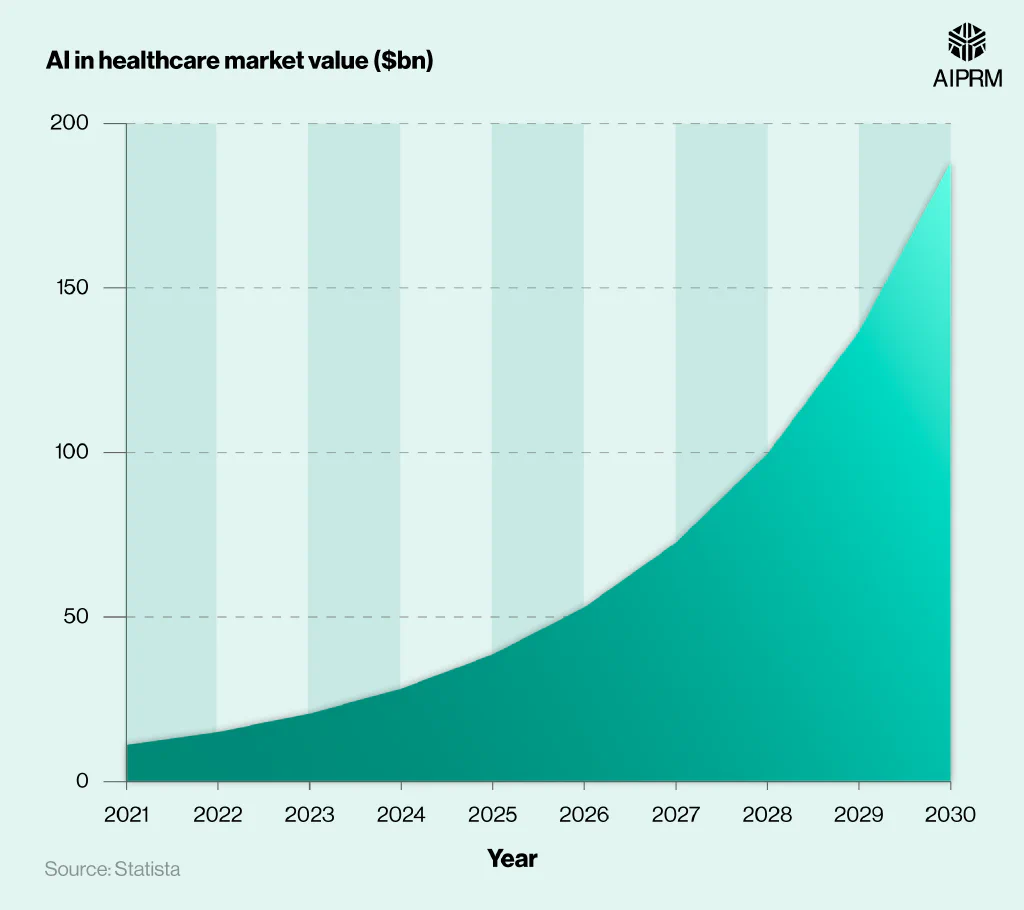
The AI in healthcare market is projected to grow year-on-year from 2023 to 2030, up to $187.95bn. This means that by 2030, around nine times more will be spent on AI in the healthcare sector compared to 2023, representing an 810% increase in its expected value and cost.
Overall, the compound annual growth rate (CAGR) of the AI market in U.S. healthcare between 2023 and 2030 currently stands at an estimated 36.1%. In terms of global AI spending in the healthcare market, the U.S. represents more than half (58%) of total revenue.
AI in education statistics #
As of 2023, revenue from the online education market is expected to reach $166.6bn. With a CAGR of almost 9.5% between 2023 and 2027, this could result in a projected market value of $239.3bn by 2027.
The largest market for online university education in 2023 is found in the U.S., with an estimated market value of £103.8bn.
One of the biggest drivers of this growth is artificial intelligence technology. By 2029, the generative AI market is expected to grow at a CAGR of 76.9%, resulting in a predicted value of $80bn for the AI market in education by 2032.
AI in the workplace statistics #
According to AI job statistics, there were 7,991 job postings for AI-related employment in the U.S. in 2023.
Based on these listings, in 2023, the most popular type of AI job available in the U.S. was a Data Engineer. In total, there were 1,898 Data Engineer jobs posted across the country, accounting for almost a quarter (23.8%) of all AI-related jobs.
A breakdown of most popular postings for AI jobs in the U.S. (2023) #
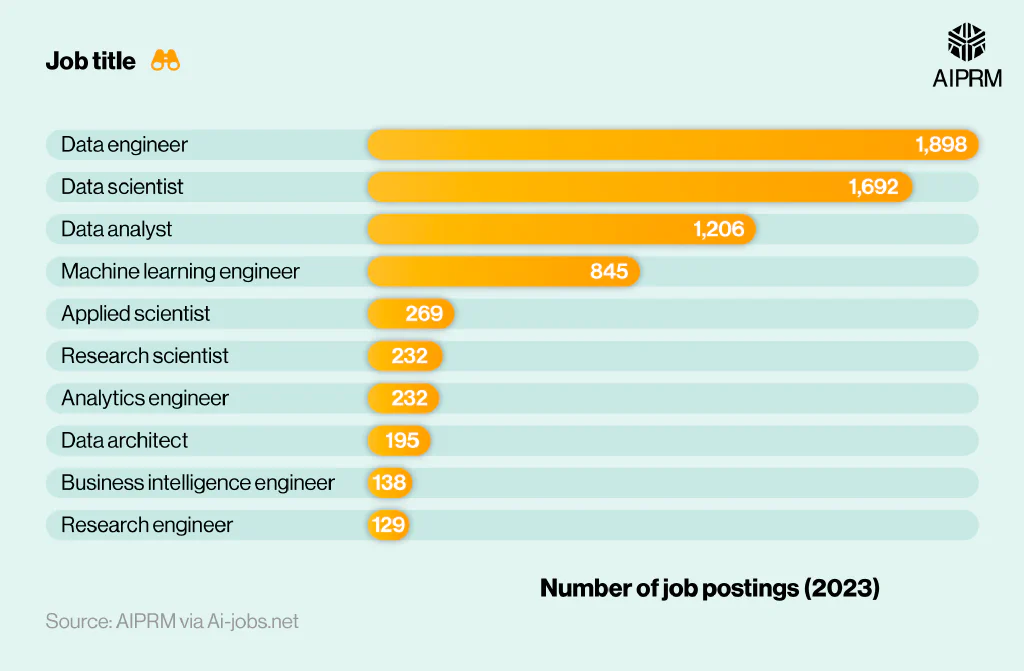
This is followed closely by Data Scientists. With around 200 fewer vacancies in 2023, this role accounted for around a fifth (21.2%) of all AI job postings in the U.S. for the year.
Data Analyst was the third most popular AI job vacancy for 2023, with 1,206 positions available (or 15.1% of all AI job postings).
At the other end of the scale, there were just 129 job vacancies for Research Engineers in 2023, over 174% fewer than Data Engineers in the top spot.
A breakdown of average salary statistics for AI jobs in the U.S. (2023) by job title #
| Job title | Number of job postings (2023) | Median average salary ($USD) |
|---|---|---|
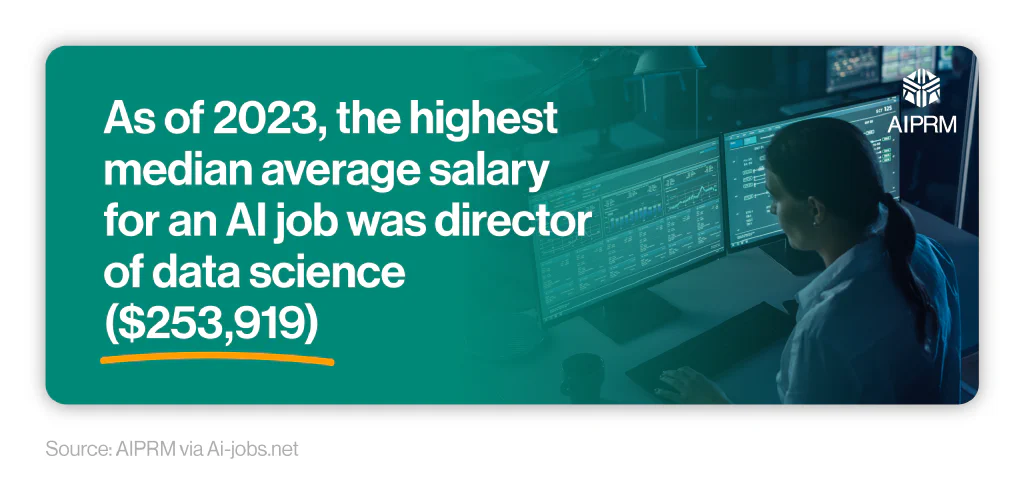
| Director of Data Science | 18 | $253,919 |
| AI Architect | 12 | $250,328 |
| Head of Data | 23 | $244,674 |
| Data Science Manager | 83 | $205,621 |
| Data Infrastructure Engineer | 12 | $201,375 |
| ML Engineer | 99 | $200,488 |
| AI Engineer | 25 | $193,242 |
| Machine Learning Engineer | 845 | $192,380 |
| Applied Scientist | 269 | $190,827 |
| Research Scientist | 232 | $190,631 |
(Source: AIPRM via Ai-jobs.net)
*Note: Only jobs with a minimum of 10 listings were selected for the final table to ensure the median average was as fair and representative as possible.
According to U.S. average salary statistics for AI jobs, those working as a Director of Data Science can expect the highest average earnings in the world of AI, with a typical salary of $253,919. This is around $3,000 a year more than the next highest-earning job in the AI industry (AI Architect).
Head of Data roles are the third highest earning, with a median average salary of $244,674. Data Science Managers, Data Infrastructure Engineers and ML Engineers each have salaries over $200,000, with the remaining four roles on the list earning in the region of $190,000.
A breakdown of overall minimum, maximum, and average salary statistics for AI jobs in the U.S. (2023) by job title #
| Job title | Maximum salary ($USD) | Mean salary ($USD) | Median salary ($USD) | Minimum salary ($USD) |
|---|---|---|---|---|
| Data Analytics Lead | $405,000 | $405,000 | $405,000 | $405,000 |
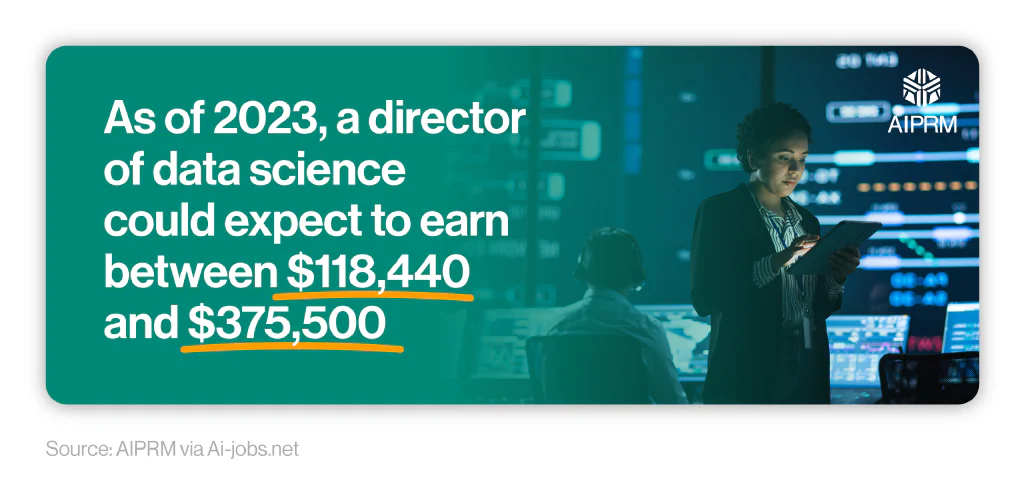
| Director of Data Science | $375,500 | $253,919 | $249,300 | $118,440 |
| Data Science Tech Lead | $375,000 | $375,000 | $375,000 | $375,000 |
| Head of Machine Learning | $330,000 | $259,000 | $259,000 | $188,000 |
| Head of Data Science | $330,000 | $224,539 | $224,000 | $110,000 |
(Source: AIPRM via Ai-jobs.net)
Based on maximum salary statistics for AI jobs, a Data Analytics Lead comes out top, with professionals in this role earning up to $405,000. By comparison, a Head of Data Science could earn a maximum of $330,000 – a difference of £75,000 per annum.
This is followed by a Director of Data Science, who could earn a maximum of $375,000. Despite this, the role has one of the largest ranges between minimum and maximum salaries of all AI jobs analyzed in our study, with a difference of $257,060.
For AI jobs with more than one listing in 2023, the highest average salary was for Head of Machine Learning ($259,000) – around $35,000 a year more than the typical salary for Head of Data Science.
A breakdown of U.S. average salary statistics for AI jobs by level of experience (2023) #
| Experience level | Median average salary ($USD) |
|---|---|
| Entry | $105,092 |
| Mid | $130,690 |
| Senior | $166,325 |
| Executive | $195,787 |
(Source: AIPRM via Ai-jobs.net)
Based on our analysis of AI job postings, those coming into the AI industry at entry level can expect an average salary of just over $105,000 a year.
The typical salary for AI jobs rises by approximately $30,000 as you progress up each experience level, up to an average of $195,787 for those in an executive position.
A breakdown of U.S. average salary statistics for AI jobs by percentage of remote working (2023) #
| Percentage of remote working | Median average salary ($USD) |
|---|---|
| 0% | $161,098 |
| 50% | $138,568 |
| 100% | $154,989 |
(Source: AIPRM via Ai-jobs.net)
Based on the percentage of remote work required for each AI job vacancy, those who are 100% office-based (no remote work) can expect the highest average salary, at $161,098. Those in AI jobs that are 100% remote can expect to earn around $6,000 less, on average.
Conversely, AI jobs with a hybrid working model (50% remote and 50% in the office) typically have the lowest average salaries ($138,568).
A breakdown of U.S. average salary statistics for AI jobs by company size (2023) #
| Company size | Median average salary ($USD) |
|---|---|
| Large | $165,060 |
| Medium | $158,575 |
| Small | $125,048 |
(Source: AIPRM via Ai-jobs.net)
Analysis of AI job listings reveals that large companies typically pay their employees more, with a median average salary of $165,060.
This is around $6,500 more, on average, compared to medium-sized companies and typically almost $40,000 a year more than smaller enterprises.
The following average salary statistics reveal the median salary for vacancies in the AI industry across the U.S. in 2023. This ranges from the lowest level of experience (entry-level/junior AI jobs) all the way up to the most experienced positions (Executive AI roles).
These stats have been further broken down into:
-
What percentage of the jobs involve remote working (with 0% being completely office-based, 50% as a hybrid-working model, and 100% being totally remote)
-
Size of the company (i.e. small, medium, or large)
-
Job count (i.e. the number of job postings across each category).
A breakdown of average salary statistics for Entry Level/Junior AI jobs in the U.S. (2023) #
| % of remote working | Company size | Job count | Median salary ($USD) |
|---|---|---|---|
| 0 | Large | 12 | $105,340 |
| Medium | 175 | $105,000 | |
| Small | 2 | $104,000 | |
| 50 | Large | 12 | $83,000 |
| Medium | 2 | $75,000 | |
| Small | 3 | $81,000 | |
| 100 | Large | 20 | $80,000 |
| Medium | 82 | $80,000 | |
| Small | 9 | $90,000 |
(Source: AIPRM via Ai-jobs.net)
When broken down by experience level, those coming in at Entry Level or Junior could earn anything between $24,000 a year working remotely for a medium-sized AI company up to $281,700 for solely office-based work at a medium-sized corporation.
The mean average salary for Entry-level and Junior AI jobs ranges from $75,000 for those at a medium-sized AI company with a hybrid working model, up to $105,340 for those employed by a large AI firm with no remote working.
A breakdown of average salary statistics for Mid Level AI jobs in the U.S. (2023) #
| % of remote working | Company size | Job count | Median salary ($USD) |
|---|---|---|---|
| 0 | Large | 35 | $139,152 |
| Medium | 846 | $125,000 | |
| Small | 9 | $120,000 | |
| 50 | Large | 10 | $132,500 |
| Medium | 2 | $163,000 | |
| 100 | Large | 41 | $113,000 |
| Medium | 373 | $116,990 | |
| Small | 4 | $130,000 |
(Source: AIPRM via Ai-jobs.net)
The median average salary for a Mid Level AI job tends to be between $113,000 and $163,000, depending on the company size and degree of remote working involved in the role. For example, a large corporation offering 100% remote working pays an average salary of $113,000. This figure jumps by almost $27,000 a year for a large corporation offering no remote working.
A breakdown of average salary statistics for Senior Level AI jobs in the U.S. (2023) #
| % of remote working | Company size | Job count | Median salary ($USD) |
|---|---|---|---|
| 0 | Large | 304 | $159,100 |
| Medium | 3,526 | $159,000 | |
| Small | 2 | $191,000 | |
| 50 | Large | 6 | $167,500 |
| Medium | 2 | $174,500 |
(Source: AIPRM via Ai-jobs.net)
The median average salary for a senior-level AI job is around $159,000 when working for a medium-sized company with no remote working. This figure typically jumps by around $8,000 a year for a large AI corporation offering a hybrid style of working.
A breakdown of average salary statistics for Executive Level AI jobs in the U.S. (2023) #
| % of remote working | Company size | Job count | Median salary ($USD) |
| 0 | Large | 3 | $250,000 |
| Medium | 140 | $180,000 | |
| 100 | Large | 4 | $295,000 |
| Medium | 91 | $210,600 | |
| Small | 3 | $200,000 |
(Source: AIPRM via Ai-jobs.net)
Executive Level jobs in the AI industry tend to have a smaller extreme in potential earnings, averaging between $180,000 and $295,000, depending on the size of the company and the extent of remote working within the role.
Once again, large AI firms tend to offer the highest average salaries, with a difference of around $45,000 a year when moving from 0% to 100% remote working ($250,000 vs $295,000, respectively).
A breakdown of AI job statistics in the U.S. by state (2023) #
| State | Percentage of AI job listings (%) |
|---|---|
| California | 26.86% |
| Remote | 18.36% |
| New York | 16.24% |
| Texas | 5.92% |
| Massachusetts | 4.70% |
| Illinois | 3.34% |
| North Carolina | 3.03% |
| Virginia | 2.88% |
| Pennsylvania | 2.88% |
| New Jersey | 2.58% |
(Source: AIPRM via Ai-jobs.net)
In terms of AI job statistics by U.S. state, California has the most AI-related job postings, with over a quarter (26.86%) of the total amount. This is followed by New York (16.24%) and Texas (5.92%).
Around a fifth (18.36%) of AI job vacancies in 2023 were for remote-based employment.
When broken down by the most popular AI job vacancy in each state, a specialized role was either first or second in each of the top four states for AI jobs and remote working.
In California, a Specialized Role accounted for 6.37% of all AI job postings – the highest percentage across any state. This was followed by 5.16% of AI jobs in New York.
A Data Engineer was the most common AI job listing in 2023 for remote working, at 4.7% of all remote AI jobs available for the year.
A breakdown of AI job statistics in the U.S. by job title and most popular AI-related skills #
| Count | Job title | Most popular listed skills (and the number of job postings they appear in) |
|---|---|---|
| 151 | Specialized Role | Architecture (53), computer science (42), engineering (38) |
| 111 | Data Engineer | AWS (76), architecture (49), azure (47) |
| 83 | Data Scientist | Computer science (47), engineering (27), machine learning (26) |
| 62 | Data Analyst | Data analysis (28), data visualization (21), data analytics (19) |
| 53 | Machine Learning Engineer | Computer science (37), engineering (28), AWS (22) |
(Source: AIPRM via Ai-jobs.net)
In total, a Specialized Role in AI was the most common job title for AI vacancies in 2023, accounting for 151 (or nearly 2%) of all postings. Architecture was the most popular skill listed in these job descriptions, appearing in more than a third (35%) of specialized role specifications.
Amazon Web Services (AWS) was the most commonly-cited AI skill across all job types, appearing in more than two-thirds (68%) of job postings for Data Engineers.
Computer science came top of the requirements for three AI job titles, having been mentioned in 57% of Data Scientist roles, nearly 70% for Machine Learning Engineers, and almost 85% of Research Scientist posts.
A breakdown of AI job statistics in the U.S. by most popular AI-related skills #
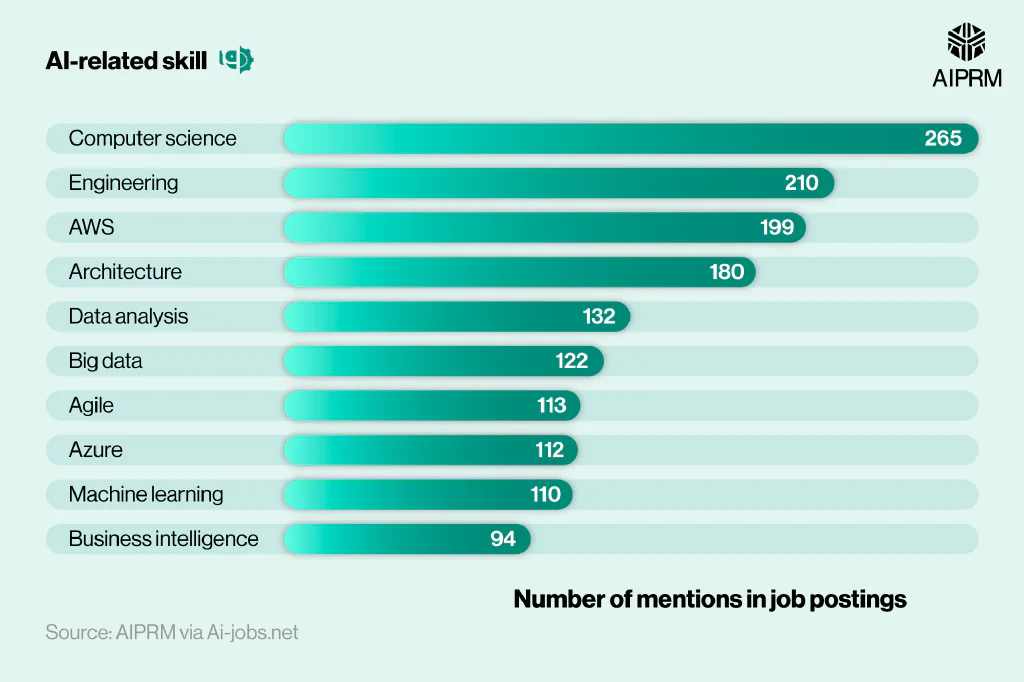
In total, computer science was the most commonly mentioned AI-related skill across all AI job listings in 2023. Having appeared 265 times across the 7,991 job adverts, this equates to around 3.3% of all AI job listings for 2023.
Computer science was followed by engineering (2.6%) and AWS (2.5%) as other popular, AI-related skills required when working in the field of AI.
A breakdown of AI job statistics in the U.S. by the probability different AI skills appeared in job adverts between 2018 and 2023 #
According to our analysis of U.S. job postings for AI-related vacancies in 2023, the AI skill that has the greatest probability of appearing in job adverts is machine learning. This figure of 0.026 means machine learning has a 2.6% chance of appearing in a job advert as of 2023 – a figure that has doubled since 2018.
Artificial intelligence is the next most likely skill to appear in U.S. job adverts in 2023 (2.1%). However, interestingly, this represents a small drop from the peak of 2.45% in May 2019.
Similarly, big data is likely to appear in 1.8% of job adverts across the U.S. in 2023 – a drop of 0.47% from May 2019.
On the flip side, data science has witnessed sustained growth in the probability of its appearance in job adverts. Between 2018 and 2023, this figure rose from 0.58% to 1.29%.
A breakdown of AI skills statistics showing the concentration of AI talent between selected countries #
| Germany | Great Britain | India | U.S.A. | |
|---|---|---|---|---|
| 2017 | 0.96% | 0.33% | 2.10% | 0.39% |
| 2018 | 1.27% | 0.45% | 2.68% | 0.53% |
| 2019 | 1.67% | 0.61% | 3.44% | 0.71% |
| 2020 | 2.14% | 0.80% | 4.63% | 0.94% |
| 2021 | 2.67% | 1.03% | 6.48% | 1.24% |
| 2022 | 3.51% | 1.41% | 9.57% | 1.74% |
| 2023* | 3.78% | 1.50% | 9.81% | 1.84% |
| 2024* | 4.28% | 1.71% | 11.24% | 2.10% |
| 2025* | 4.77% | 1.92% | 12.66% | 2.36% |
| 2026* | 5.27% | 2.13% | 14.09% | 2.62% |
| 2027* | 5.77% | 2.34% | 15.52% | 2.88% |
| 2028* | 6.27% | 2.55% | 16.95% | 3.14% |
| 2029* | 6.77% | 2.76% | 18.37% | 3.40% |
| 2030* | 7.26% | 2.97% | 19.80% | 3.66% |
(Source: AIPRM via OECD)
- Forecasted data based on trends from 2017-22.
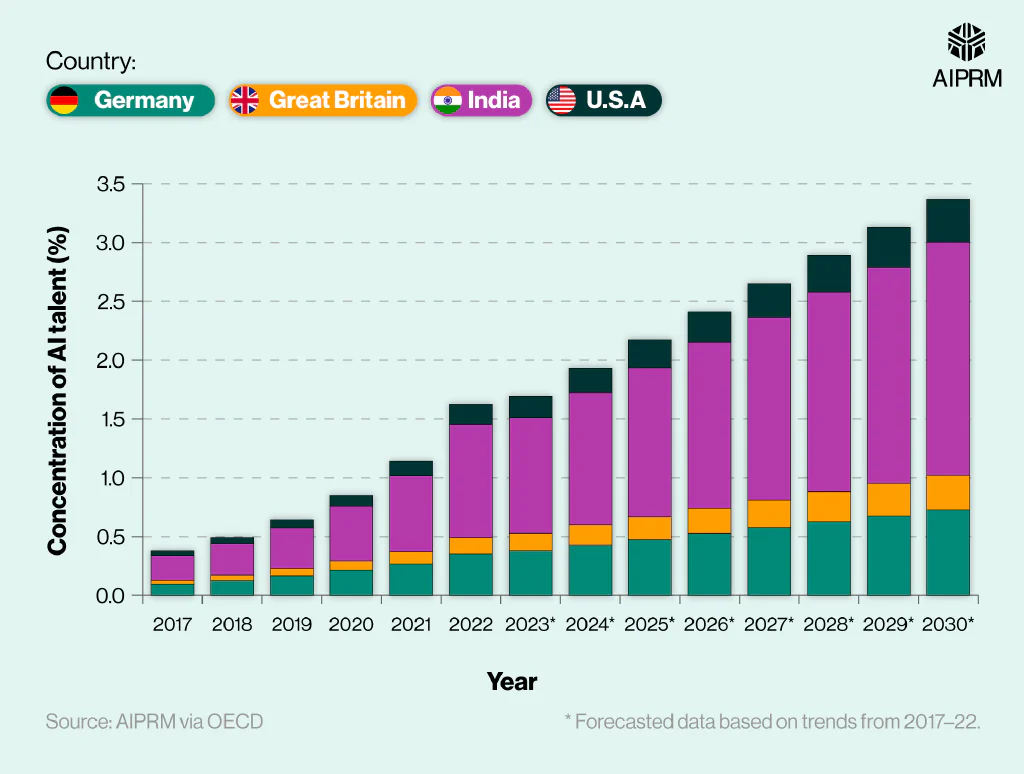
The concentration of AI talent is expressed as the percentage of LinkedIn members with AI skills or who are hired in an AI role. This dataset has been broken down to see how the rates of talent concentration have changed between different countries over time.
As of 2022, India was leading the way in terms of AI talent concentration, with just under one in 10 (9.57%) of its LinkedIn members either working in the AI sector or having AI-related skills on their profile. This figure also represents a 47% rise from the previous year – the largest increase across all four countries.
India’s AI statistics dwarf that of second-placed Germany, at 3.51% for 2022 – a rise of almost a third (31.46%) from 2021.
By comparison, just 1.74% of U.S. LinkedIn members had AI-related skills and/or employment on their profile in 2022. Still, this represented a 40% rise from 2021 – the second-largest increase of all four countries in our study.
That said, between 2017 and 2022, the average year-on-year change in talent concentration for the U.S. was 35.63% – 5.37% greater than the combined average for Germany, Great Britain, and India.
Based on current trends, the percentage of LinkedIn profiles with AI-related skills could more than double by 2030, with Great Britain and the U.S. both seeing a 110% rise by the end of the decade.
A breakdown of AI hiring statistics over time between different countries #
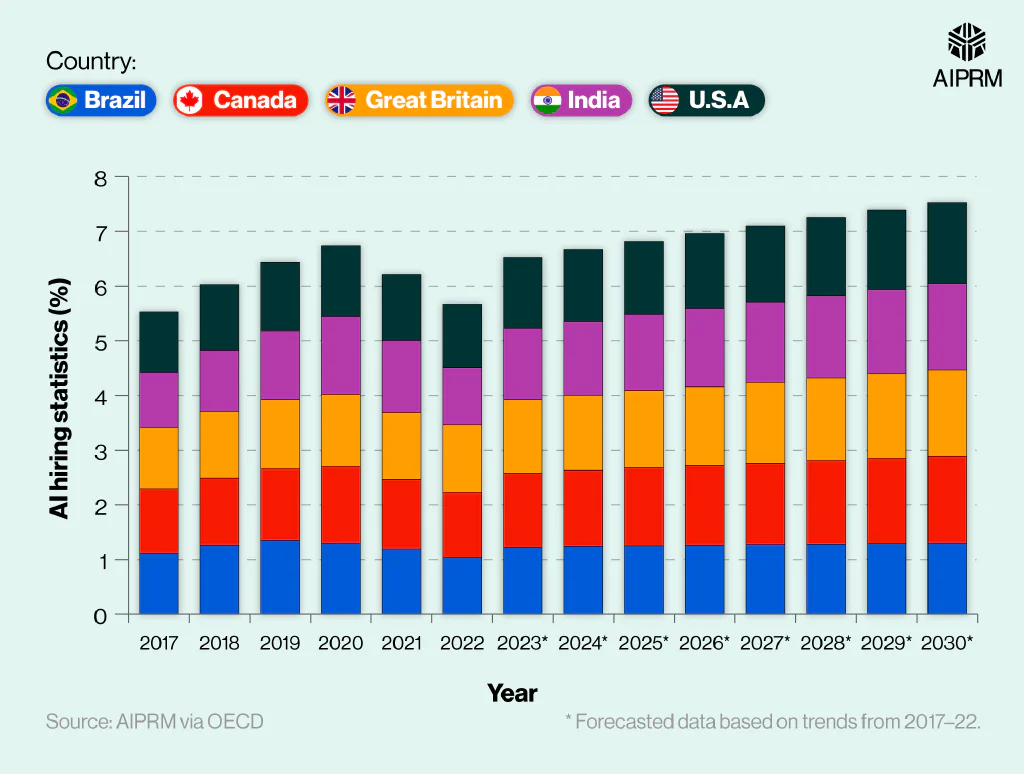
| Brazil | Canada | Great Britain | India | U.S.A | |
|---|---|---|---|---|---|
| 2017 | 1.11 | 1.18 | 1.12 | 1.01 | 1.11 |
| 2018 | 1.26 | 1.23 | 1.22 | 1.11 | 1.21 |
| 2019 | 1.35 | 1.31 | 1.26 | 1.26 | 1.26 |
| 2020 | 1.3 | 1.4 | 1.32 | 1.42 | 1.3 |
| 2021 | 1.19 | 1.28 | 1.22 | 1.31 | 1.21 |
| 2022 | 1.04 | 1.19 | 1.23 | 1.05 | 1.16 |
| 2023* | 1.22 | 1.36 | 1.34 | 1.31 | 1.29 |
| 2024* | 1.24 | 1.39 | 1.37 | 1.35 | 1.32 |
| 2025* | 1.25 | 1.43 | 1.41 | 1.39 | 1.34 |
| 2026* | 1.26 | 1.46 | 1.44 | 1.43 | 1.37 |
| 2027* | 1.27 | 1.49 | 1.48 | 1.46 | 1.4 |
| 2028* | 1.28 | 1.53 | 1.51 | 1.5 | 1.43 |
| 2029* | 1.29 | 1.56 | 1.55 | 1.54 | 1.45 |
| 2030* | 1.3 | 1.59 | 1.58 | 1.58 | 1.48 |
(Source: AIPRM via OECD)
- Forecasted data based on trends from 2017-22.
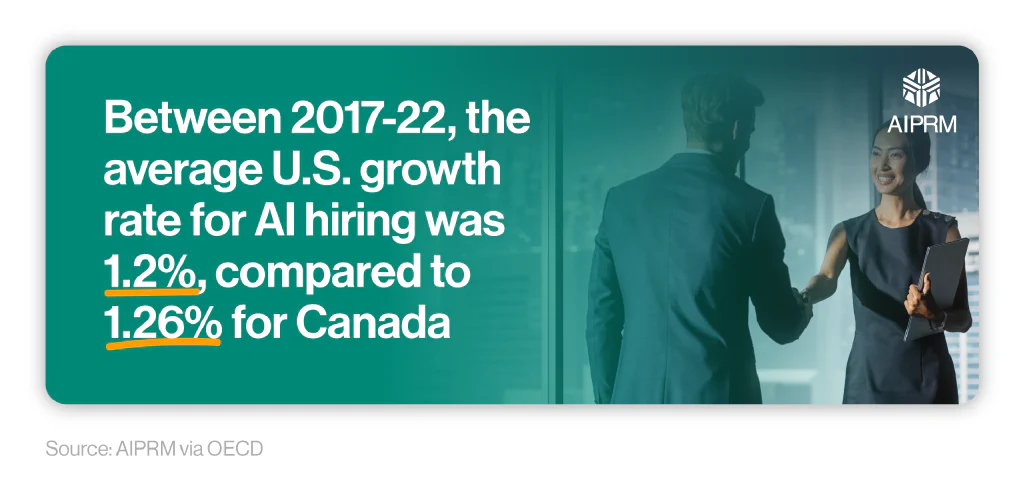
Between 2017 and 2022, the U.S. average growth rate in AI hiring stood at 1.2%. This was marginally lower than the average for Brazil, Canada, Great Britain, India, and the U.S. (1.22%).
Even though the U.S. saw consistent growth in AI hiring over this period, the pace is marginally lower than in other countries. For example, Canada had the fastest rate of AI hiring between 2017 and 2022, at 1.26%. This could be down to several factors, including market saturation or the fact the U.S. already has a more mature AI sector by comparison.
For most countries, AI hiring statistics tend to be lower at the start of the year (Q1) and slowly increase as the year progresses. The notable exception to this was in 2021 when the opposite happened for most countries due to the Covid-19 pandemic’s huge financial impact on companies worldwide.
By 2030, it’s predicted that AI hiring statistics for Canada, Great Britain, and India will all be around the same (just under 1.6%). However, as a percentage increase from 2022, this represents a rise of 50.5% for India compared to just over a quarter (+28.5%) for Great Britain.
Respective figures for the U.S. over this period reflect an increase of more than a quarter (+27.6%) in AI hiring by 2030, where roughly 1.48% of the American workforce could be employed in an AI-related job.
Statistics on AI replacing jobs #
Published by the World Economic Forum (WEF), The Future of Jobs Report 2023 details the perspectives of 803 companies, who collectively employ 11.3 million people worldwide across 27 industries and 45 economies.
AI statistics from their study found that between 2023-27:
-
Over 85% of companies plan to implement new technologies (such as digital platforms and apps).
-
Employers believe almost a quarter of jobs (23%) will be affected by a structural labor market churn
-
There could be an estimated global net decrease of 14 million jobs (or roughly 2% of current employment statistics - based on 83 million job losses and 69 million jobs created).
-
Education (+10%) and agriculture (+30%) may see the largest uptick in AI jobs, with around 26 million job losses in administrative roles.
-
Around 44% of workers’ skills could become disrupted, with technological literacy the third-fastest growing core skill requirement in the workplace.
-
Six in 10 workers will require additional training to fulfill their jobs, but only 50% feel they currently have adequate training opportunities in the workplace.
-
Working with AI is the third most important training priority for businesses, behind analytical thinking and creative thinking.
Check out our full list of AI guides and resources to see how artificial intelligence can be used to benefit your business.
A breakdown of AI replacing jobs statistics across different industries #
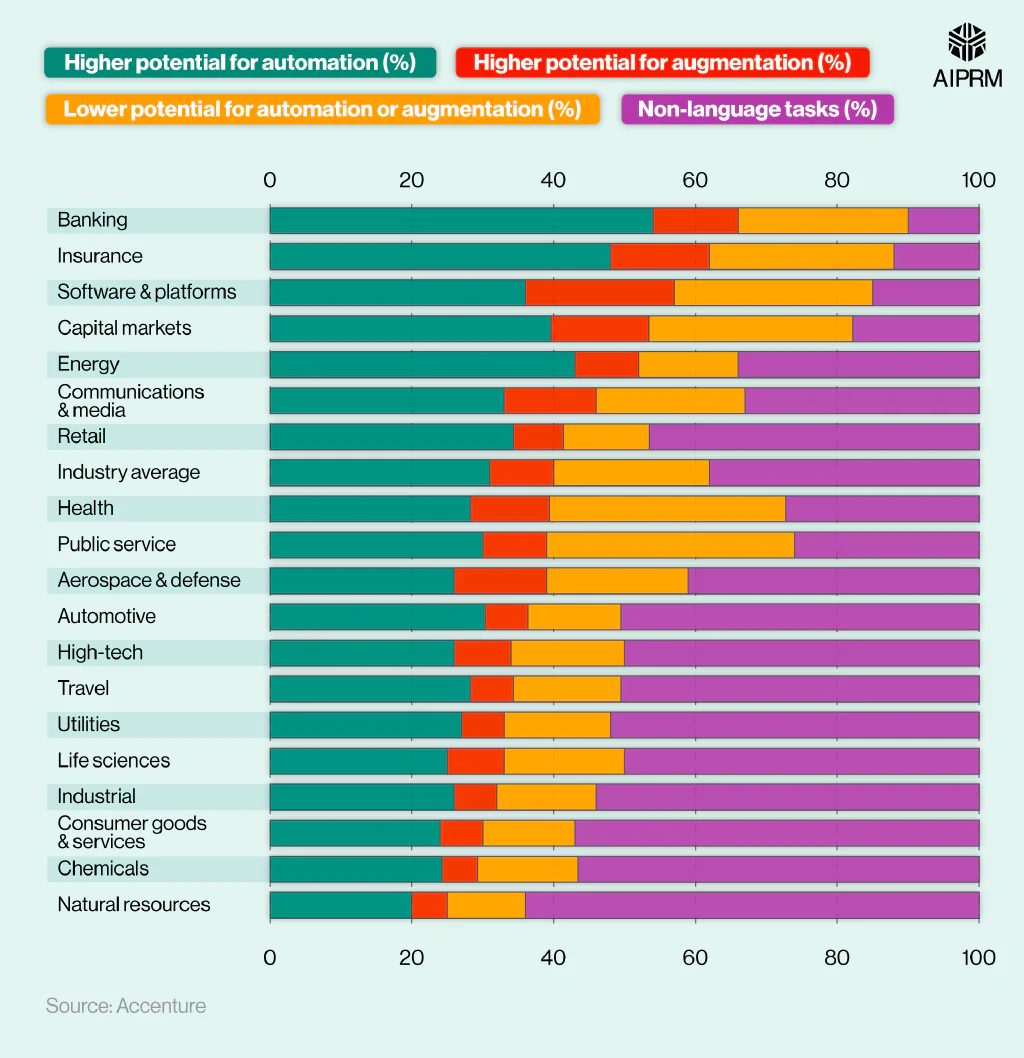
Research by Accenture indicates that around 40% of working hours across industries could be impacted by AI in the future, particularly Large Language Models (LLM).
In terms of specific industries where AI could replace jobs:
-
Banking is the sector most likely to be affected by generative AI, with over half (54%) of business tasks likely to be replaced by automation. This is followed by insurance (48%) and energy (43%).
-
Augmentation is likely to replace around a fifth (21%) of work in the software and platform industry, followed by 14% of tasks in both insurance and capital markets.
-
Around a third of work in both the health sector (35%) and the public service industry (33%) is at low risk from automation or augmentation.
In terms of automation, AI in retail is likely to affect around a third (34%) of jobs, which is marginally higher than the industry average of 31%.
The industries least likely to be affected by AI in the future are those with the highest percentage of non-language tasks. This is mainly those working in natural resources (64%), consumer goods and services (57%), and chemicals (56%).
Statistics on AI replacing jobs in North America #
Of all the technologies available to businesses in North America, artificial intelligence is likely to replace elements of most jobs, resulting in a net effect of +20% on the jobs industry. This suggests that by 2027, there will be around a fifth more jobs available in North America due to the implementation of AI.
This is around 10% behind e-commerce businesses and digital trade.
A breakdown of technologies and their impact on job creation #
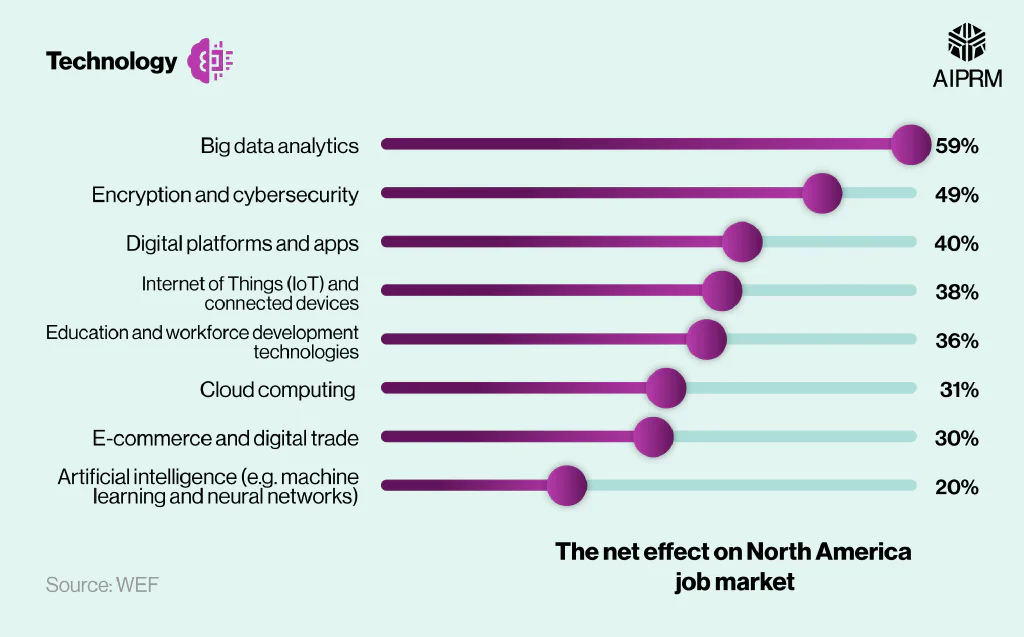
The biggest positive impact on jobs will be caused by big data analytics, with a net effect of 60% more jobs across North America by 2027. This is followed by +48% caused by encryption and cybersecurity and +40% from the introduction of digital platforms and apps.
AI government investment statistics #
As AI is being used on a personal, educational and commercial basis, governments around the world are making major investments in AI development and adoption.
AI government investment statistics around the world (exclusive data) #
Artificial intelligence statistics show that, between 2019–23, the U.S. government invested the most in AI, compared to other countries, at almost $328bn. This is around $195bn more than second-placed China across the same period.
Both countries dwarf the third-placed U.K. in the rankings ($25.5bn) – almost 13 times less than the U.S. by comparison.
A breakdown of AI government investment statistics by country #
| Country | Sum of investment in last 5 years (millions USD) | Investment in past 5 years (per thousand $ GDP) | Investment in past 5 years, as a percentage of USA investment (per thousand $ GDP) |
|---|---|---|---|
| Singapore | 7,005 | 15.01 | 116.30 |
| Sweden | 8,281 | 14.13 | 109.53 |
| The U.S. | 328,548 | 12.90 | 100.00 |
| Estonia | 415 | 10.89 | 84.44 |
| U.K. | 25,541 | 8.32 | 64.46 |
| China | 132,665 | 7.39 | 57.24 |
| South Korea | 10,348 | 6.21 | 48.16 |
| Canada | 12,457 | 5.82 | 45.12 |
| India | 16,147 | 4.77 | 36.97 |
| Switzerland | 3,239 | 4.01 | 31.08 |
(Source: AIPRM via OECD and World Bank)
When AI investment statistics are judged against the country’s GDP, Singapore comes out on top. Despite having invested a modest $7bn when compared to other nations, this represents more than 15% of their relative wealth per thousand $GDP.
Singapore is followed by Sweden, with 14.13% of its GDP spent on AI development.
By contrast, the U.S. invests around 12.9% of its GDP in the development of its AI infrastructure, compared to 8.32% for the U.K.
In terms of how AI investment between countries compares to the U.S., Singapore is once again leading the way. At 116.3%, this means the rate of AI investment by the Singapore government is around 16% more compared to their U.S. counterparts (in relative terms per billion $GDP). Likewise, Sweden stands at 109.53%, as the only other nation investing more than the U.S. in AI, in relative wealth terms.
By comparison, the UK’s level of AI investment between 2019-23 stands at 64.46% (relative to U.S. GDP), meaning almost a third less AI spending took place during this period in financial relation to the U.S.
How much would each country need to invest in AI to catch up with the United States? #
Based on current levels of spending, China is most likely to catch up with the U.S. in terms of AI investment. In order to achieve this by 2030, China would need to spend over $94bn on its AI infrastructure before the end of the decade to achieve the same level of investment as the U.S.
A breakdown of AI investment statistics and how much each country would need to spend on AI in order to catch up with the U.S. by 2030, 2040, and 2050 #
| Country | Catch up by 2030 ($mn) | Catch up by 2040 ($mn) | Catch up by 2050 ($mn) |
|---|---|---|---|
| China | 94,237 | 99,242 | 117,915 |
| United Kingdom | 157,923 | 157,408 | 182,527 |
| India | 162,589 | 161,996 | 187,814 |
| Israel | 163,436 | 163,180 | 189,369 |
| Germany | 163,821 | 163,483 | 189,676 |
| Canada | 164,441 | 164,243 | 190,634 |
| Korea | 165,430 | 165,066 | 191,502 |
| France | 165,637 | 165,342 | 191,858 |
| Sweden | 166,289 | 165,715 | 192,143 |
| Singapore | 167,118 | 166,934 | 193,766 |
(Source: AIPRM via OECD and World Bank)
The UK is second most likely to catch up with the U.S. in terms of AI investment. However, they would need to spend an additional $157.9bn by 2030 in order to achieve this goal.
Based on 2023 levels of AI investment, how long would it take for countries to catch up with the United States? #
| Country | Catch up with the U.S. in 2030 (years) | Catch up with the U.S. in 2040 (years) | Catch up with the U.S. in 2050 (years) |
|---|---|---|---|
| China | 14 | 38 | 72 |
| United Kingdom | 79 | 195 | 361 |
| India | 119 | 291 | 538 |
| Israel | 141 | 344 | 636 |
| Germany | 145 | 355 | 656 |
| Canada | 164 | 400 | 740 |
| Korea | 183 | 447 | 825 |
| France | 193 | 472 | 872 |
| Sweden | 200 | 486 | 897 |
| Singapore | 274 | 666 | 1,231 |
(Source: AIPRM via OECD and World Bank)
As of 2023, China is the country most likely to catch up with the U.S. in terms of AI spending statistics.
Assuming China maintains the same level of AI investment from 2023, it would take them 14 years (until 2037) to be at the same level of investment as the U.S for artificial intelligence. If China sustained this level of spending into the future, it would take them 38 years (until 2061) to be where the U.S. reaches in 2040, and a further 34 years (until 2095) to be where the U.S. is in 2050.
This means, by the end of the century, China could be 45 years behind the America in terms of AI investment, if they continue to invest the same amount of money year-on-year as 2023.
The UK is the next best-placed country to catch up with the U.S. in terms of AI investment. However, if the UK maintains the same level of AI spending as 2023, then it would take them until 2102 to match the where the U.S. will be in 2030 (72 years behind in terms of AI development).
A breakdown of U.S. government spending statistics on AI investment #
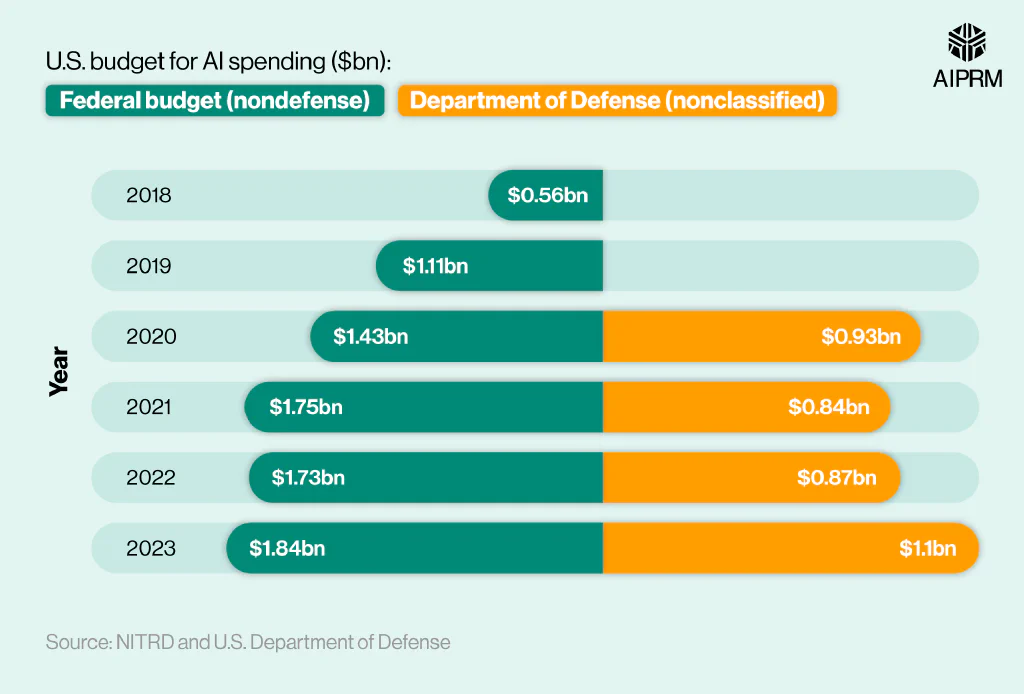
Artificial intelligence statistics reveal that, as of 2022, the U.S. government spent $3.28bn on AI investment – an increase of $0.58bn from the previous year. Since 2018, the cost of AI to the U.S. government has more than doubled, from just over $1.5bn to almost $3.3bn in 2022.
In December 2022, the National Science and Technology Council published a report on the cost of AI to the public sector, specifically for nondefense U.S. government agencies. As of 2022, around $1.73bn was allocated to AI research and development (R&D) by the U.S. government – a slight decrease of $0.02bn from the previous year.
In 2023, approximately $1.84bn was requested for AI R&D – an increase of 6% from 2022, to the tune of an extra $0.11bn.
In all, the total U.S. federal budget for AI R&D more than tripled between 2018 and 2023.
Between 2020 and 2023, the U.S. Department of Defense’s budget for AI R&D stood at $1.1bn in 2023 – a rise of $0.23bn from 2022.
A breakdown of U.S. government spending on AI between 2018 and 2022 by segment #
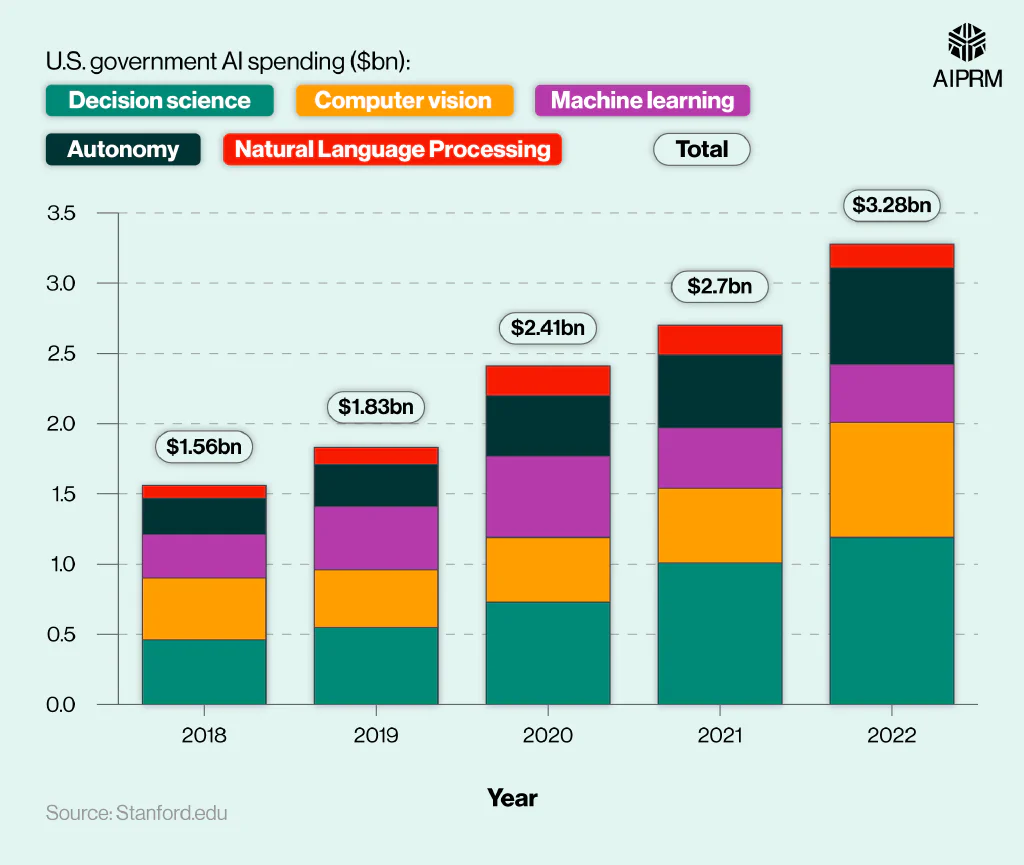
Artificial intelligence statistics from 2022 indicate more than a third (36%) of U.S. government AI spending for the year was on decision science. This study of the decision-making process (at an individual and population level) saw an increase of $0.18bn from 2021. However, the largest increase was seen in computer vision spending, from $0.53bn to $0.82bn.
Since 2018, the cost of AI to the U.S. government has:
-
More than doubled for decision science (+$0.73bn)
-
Almost doubled for computer vision (+$0.38bn)
-
Increased by a third for machine learning (+$0.1bn)
-
Almost tripled for autonomy (+0.43bn)
-
Practically doubled for natural language processing (+$0.08bn).
Government AI strategy statistics #
In March 2017, Canada launched the world’s first national AI strategy. By December 2022, almost a third of global governments (62 countries) had implemented a similar approach.
A breakdown of government AI strategy statistics by country and year #
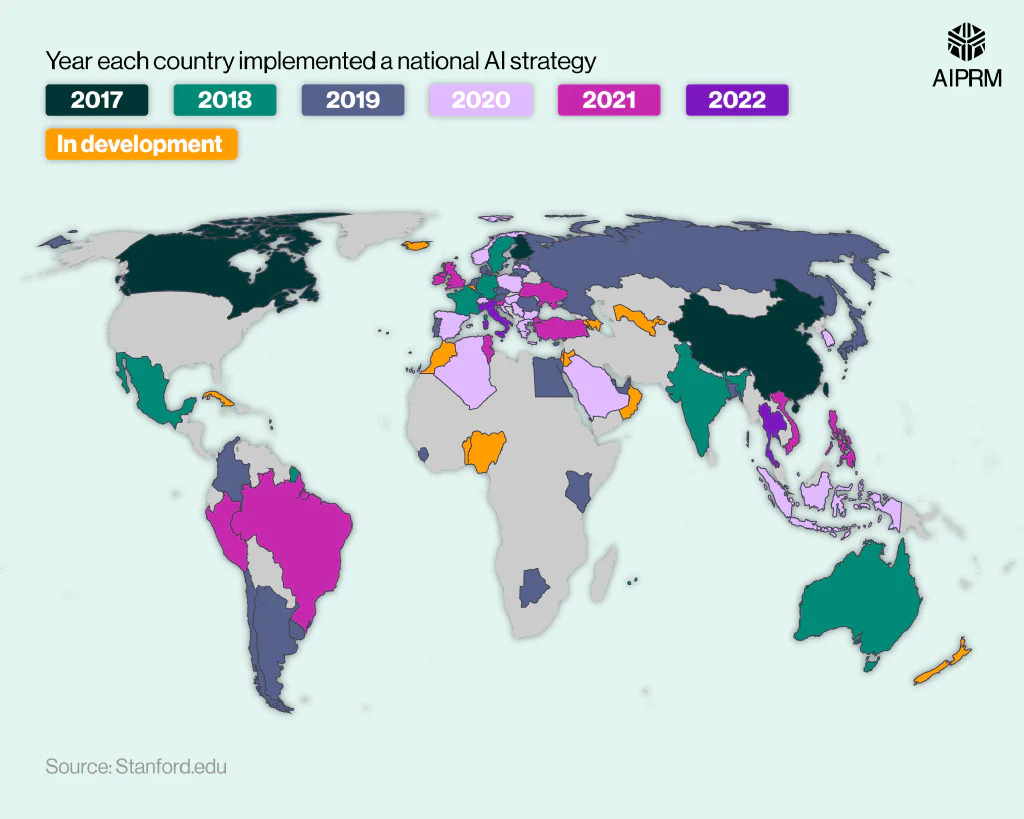
The U.S. followed suit in 2019, which saw 25 other countries introduce a national AI strategy in the same year.
As of 2022, 14 countries had an AI national strategy in the development stage. Once implemented, the global total will include 76 nations (or nearly 40% of all countries) with a national AI strategy ratified by their respective governments.
AI influencer statistics #
Kai-Fu Lee – a prominent figure in the world of AI and known for his work in machine learning, speech recognition, and the development of computer vision technologies – had the most Twitter followers in 2023 (1.5 million). The former President of Google China has almost 600 thousand more Twitter followers than Andrew Ng, the next highest-placed AI influencer.
A breakdown of the top AI influencers by number of Twitter followers #
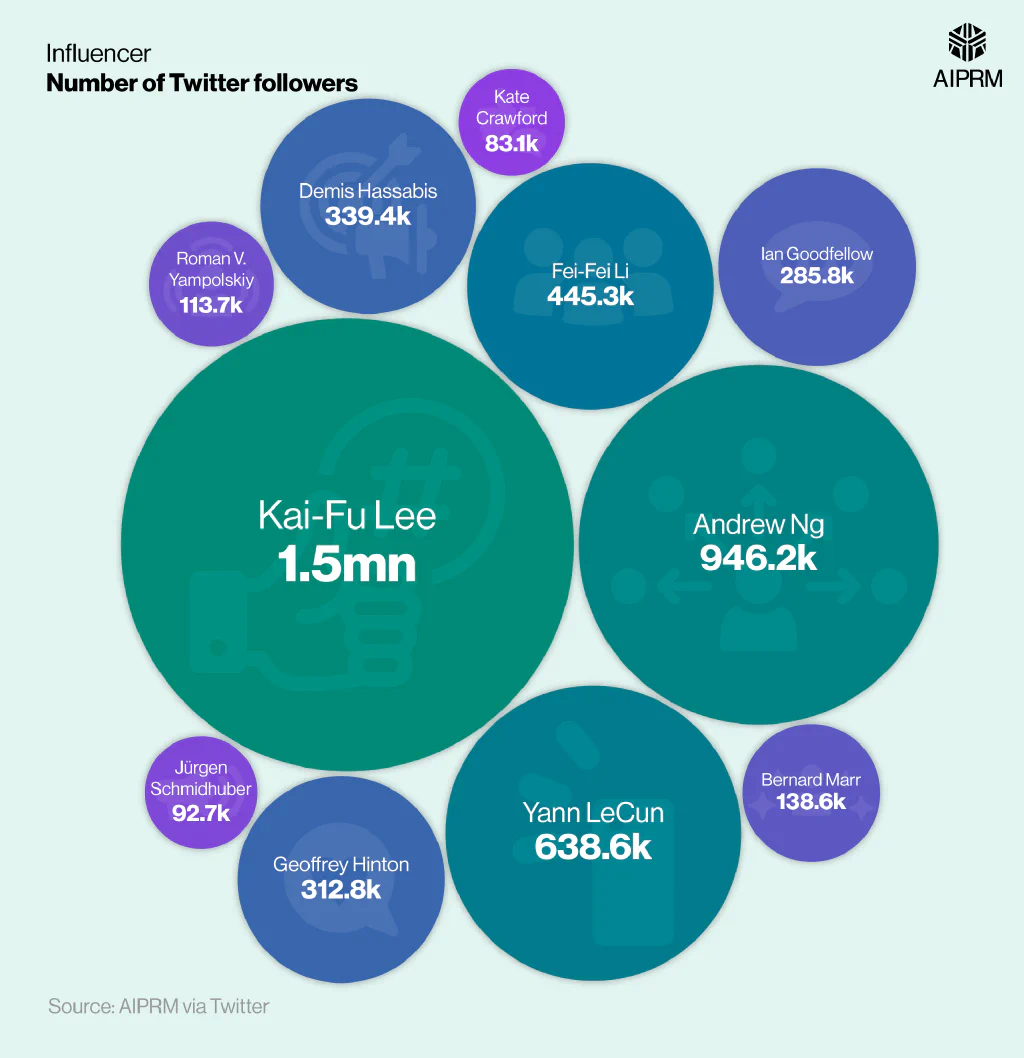
At just under 950,000 followers, Andrew Ng is the second most prominent name in artificial intelligence. As the co-founder of Coursera, and former head of Baidu AI Group/Google Brain, Andrew Ng is also a professor at Stanford University. His online courses for machine learning have educated millions around the globe, and significantly contributed to people’s understanding and application of AI.
Ng has around a third more followers than third-placed Yann LeCun – the Vice President and Chief AI Scientist at Facebook. Boasting almost 639 thousand Twitter followers, LeCun has played an important role in the world of machine learning, computer vision, mobile robotics, and computational neuroscience.
A breakdown of top influencers at OpenAI by the number of Twitter followers #
| Name | Role at OpenAI | Approximate number of Twitter followers (2023) |
|---|---|---|
| Elon Musk | Initial Board Member | 200mn |
| Sam Altman | Co-founder, CEO | 3mn |
| Greg Brockman | Co-founder, President | 700k |
| Ilya Sutskever | Co-founder | 400k |
| Bret Taylor | Board Chairman (2023) | 200k |
| Wojciech Zaremba | Co-founder | 80k |
(Source: AIPRM via Twitter)
OpenAI has fast become one of the largest artificial intelligence research organizations in the world. When looking at OpenAI hires, Elon Musk heads the chart, and is the top AI influencer at the company, with around 200 million Twitter followers (2023).
Although initially involved with OpenAI, his current level of involvement is unclear. The CEO of SpaceX and Tesla has historically made significant contributions to technology and entrepreneurship. As of 2023, he had 197 million more followers than second-placed Sam Altman.
Altman is a co-founder and the CEO of OpenAI. Known for his work in venture capital, and a leading advocate of AI technologies, his three million Twitter followers in 2023 placed him above fellow OpenAI co-founder Greg Brockman (approximately four-and-a-half times more followers by comparison).
Brockman (President of OpenAI, as of 2023) is the third highest-placed AI influencer at OpenAI. With around 700,000 Twitter followers, the former CTO of Stripe had around 300 thousand more followers in 2023 compared to another OpenAI co-founder, Ilya Sutskever, in fourth.
FAQs about AI #
What is artificial intelligence?
Artificial intelligence (AI) is a field of computer science that uses machines to perform tasks and cognitive functions usually associated with humans.
How does artificial intelligence work?
AI systems work by using progressive learning algorithms. By combining large datasets, AI can find structure and regularity in the data, allowing them to acquire skills, learn patterns, problem-solve, and make predictions.
Who invented artificial intelligence?
The term “artificial intelligence” was first coined and used by John McCarthy and Marvin Minsky at the Dartmouth Summer Research Project on Artificial Intelligence (DSRPAI) in 1956.
However, a young British polymath named Alan Turing was the first to question the possibility of machines using data and reasoning for problem-solving (just like humans) in his 1950 paper “Computer Machinery and Intelligence”.
Why is artificial intelligence important?
Artificial intelligence (AI) is important for several reasons. Computers are designed to automate complex processes, resulting in better decision-making than humans. The speed at which AI can handle and analyze multiple datasets should improve the quality, effectiveness, and creativity of outcomes. Better analytic and resource utilization also leads to potentially significant cost reductions.
AI can also identify gaps and opportunities in the market, while simultaneously providing hyper-personalization for your customer base. This ability to curate information in real-time alongside high-touch experiences can help drive customer growth, retention, and satisfaction.
How will artificial intelligence change the future?
Artificial intelligence has the potential to change the future of humans in many ways. It could revolutionize our sense of time by completing tasks more efficiently, allowing the human workforce more time to focus on aspects that require a human element, such as creativity and empathy. This ability to replace potentially tedious, time-consuming, and/or dangerous tasks in the workplace may also amplify human effectiveness and change how we learn.
Alongside this, the use of AI could also boost efficiency in the diagnosis and treatment of healthcare, leading to fuller and healthier lives for the human population.
What is artificial intelligence used for?
Artificial intelligence is used to perform a variety of tasks across multiple sectors. Those industries that require large datasets, such as banking, insurance, and pharmaceuticals, use AI to analyze this information and save time compared to human processing.
AI is also used on a variety of scales, from an individual level (such as facial-recognition software), up to a national level (such as monitoring network activity and entry points for security purposes).
How much does artificial intelligence cost?
The cost of artificial intelligence will depend on the type of AI being implemented and the scale cost being measured. Estimates suggest the global AI market size in 2023 could be worth up to $454bn.
However, the price of ChatGPT with AIPRM starts from as little as $10 per month, so it depends on what sort of AI you need and how much you’re willing to invest.
Do you have a question you want answered about AI? Head over to our community forum for some of the most frequently asked questions about artificial intelligence.
AI sources and methodology #
https://www.precedenceresearch.com/artificial-intelligence-market
https://aiindex.stanford.edu/wp-content/uploads/2023/04/HAI_AI-Index-Report_2023.pdf
https://www.forbes.com/advisor/business/software/ai-in-business/
https://www.forbes.com/advisor/business/ai-statistics/
https://www.reuters.com/technology/chatgpt-traffic-slips-again-third-month-row-2023-09-07/
https://www.forbes.com/advisor/business/artificial-intelligence-consumer-sentiment/
https://www.rask.ai/research/ai-in-education
https://arxiv.org/abs/2304.03784
https://www.edweek.org/technology/ai-literacy-explained/2023/05
https://doodlelearning.com/us/math/guides/ai-in-education
https://assets.kpmg.com/content/dam/kpmg/au/pdf/2023/trust-in-ai-global-insights-2023.pdf
https://www.cnas.org/publications/reports/the-american-ai-century-a-blueprint-for-action
https://www.grandviewresearch.com/industry-analysis/artificial-intelligence-ai-healthcare-market
https://www.statista.com/outlook/dmo/eservices/online-education/worldwide
https://www.gminsights.com/pressrelease/artificial-intelligence-ai-in-education-market
https://www.weforum.org/publications/the-future-of-jobs-report-2023/
https://www.weforum.org/publications/the-future-of-jobs-report-2023/future-of-jobs-data-explorer/
https://www.nitrd.gov/pubs/FY2023-NITRD-NAIIO-Supplement.pdf
Data sources and methodology for ‘Government investment in AI’
https://data.worldbank.org/indicator/NY.GDP.MKTP.CD
Data from 2017-23 was used to forecast the future trends for Government investment in AI, to calculate how much each country would need to spend in order to catch up with the U.S. by 2030, 2040, and 2050. In addition, a calculation was also made for how many years it would take each country to catch up with the U.S. if their level of AI investment remained the same as 2023 going forward.
Data sources for ‘AI in the workplace’
https://www.kaggle.com/datasets/joyshil0599/data-science-jobs-comprehensive-dataset/data
https://oecd.ai/en/data?selectedArea=ai-jobs-and-skills
Data from 2017-23 was used to forecast the future trends in AI workplace statistics between 2024 and 2030.
Methodology for survey data
Our survey was conducted in December 2023 and involved 6,000 U.S. adults. In order to make the survey as representative as possible, a minimum of 100 people were selected from each state, across age ranges and genders.