100+ Must-Know Robotics Statistics 2025

According to the latest robotics statistics from the International Federation of Robotics (IFR), around 4.3 million robots operated in factories around the world as of 2023 – a 10% increase from the previous year. Annual robotic installations also exceeded 500,000 in 2024 for the third consecutive year.
As a rapidly growing industry, robotics has the potential to impact our lives in a multitude of ways, both domestically and in the workplace. With this in mind, the AIPRM team has compiled a robotics statistics report with the latest facts and stats for 2025 and beyond. This includes details on the global robotic market across different regions and sectors, the current job market for robotic engineers, robotic usage, and more.
Top 10 robotics statistics to know in 2025 #
- The global robotics market was worth an estimated $94.54 billion in 2024.
- The medical sector is projected to account for around a quarter (27.03%) of the global robotics market in 2025.
- The average cost of a service robot in 2024 was $11,510 compared to $21,350 for a typical industrial robot.
- Just under half (46%) of the global robotics market revenue comes from the Asia Pacific region in 2023.
- The US generated the highest amount of revenue from robotics in 2024 across all nations ($9.4 billion).
- The Republic of Korea has the highest robot density in the world, with 1,012 robots per 10,000 employees, compared to a global average of 151 robots per 10,000 employees.
- A projected 161,766 robotic engineer jobs are forecast to be available in 2025 across the US – a rise of over 6% from 2020.
- The projected average salary of a US robotics engineer in 2025 was $114,789 – an increase of 10.3% from 2020.
- It’s estimated that there is approximately one robot for every 71 humans in the workplace across manufacturing industries.
- According to the IFR, the total operational stock of industrial robots globally was approaching 4.3 million units in 2023.
Global robotics market statistics #
According to Precedence Research, more than half (52%) of the global robotics market consisted of traditional industrial robots in 2023, with almost three-quarters (72%) falling under the hardware category.
By application, the manufacturing sector accounts for more than two-thirds (68%) of the overall robotics market, with the lion’s share of revenue coming from the Asia Pacific region (46%).
Robotics market size #
As of 2024, the global robotics market was worth an estimated $94.54 billion. This represents a rise of 14.7% from 2023.
To put this into context, the global AI market was estimated to be worth around $638.23 billion in 2024. This means the robotics market was equal to around a seventh (14.81%) of all money generated in the world of AI.
Robotics technology market size (2023-34) #
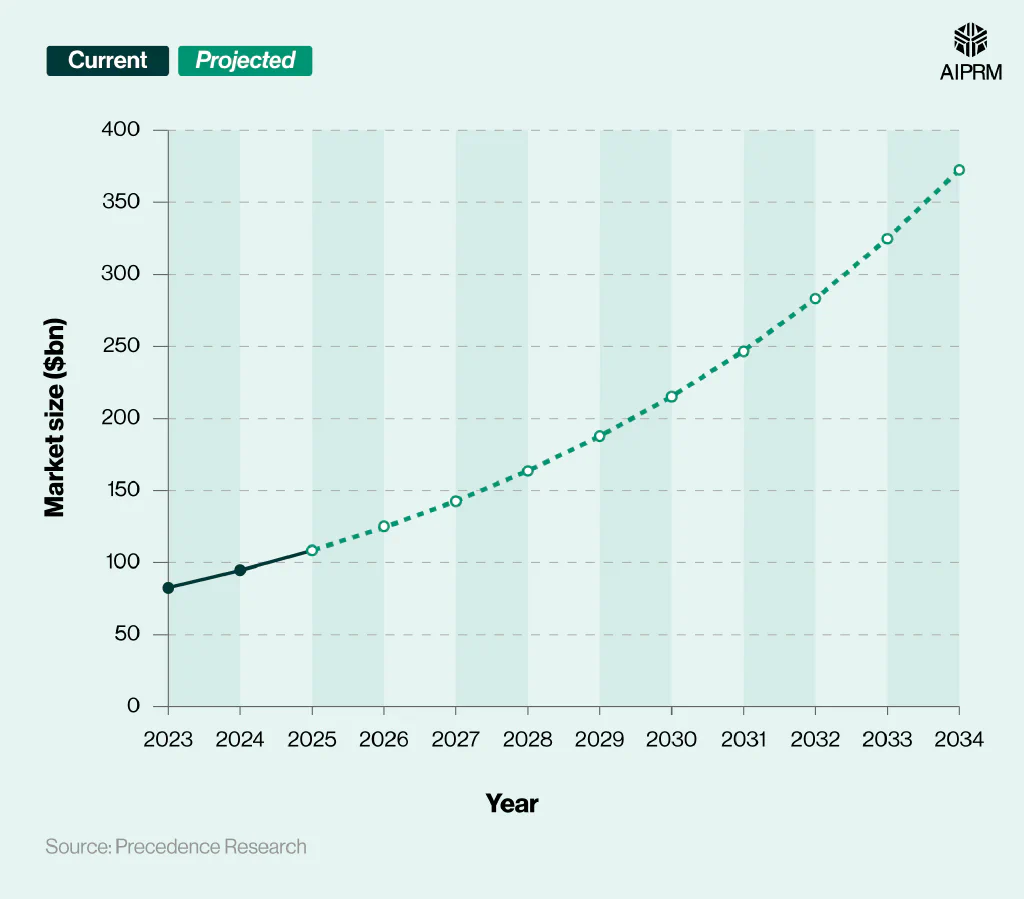
With an anticipated Compound Annual Growth Rate (CAGR) of 14.7% between 2024 and 2034, experts predict that the robotics market size could exceed $372 billion by 2034 – nearly four times its value in 2024.
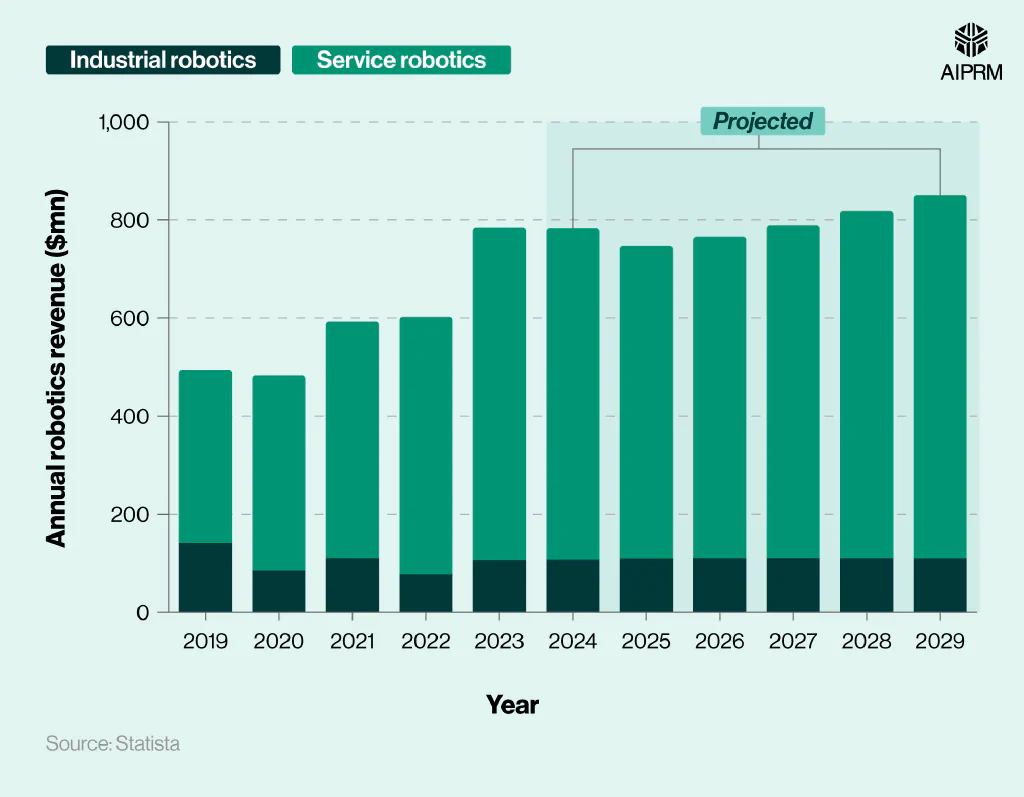
Global revenue from industrial and service robotics (2019-29) #
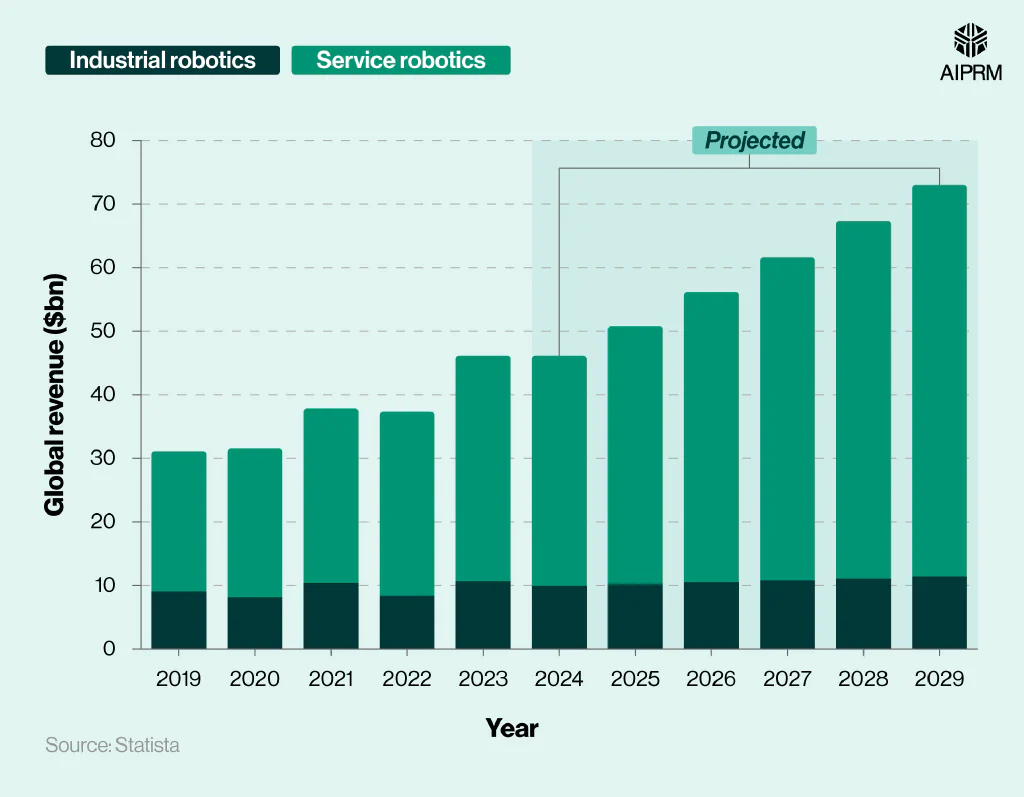
Revenue from the global robotics market is expected to reach $50.8 billion in 2025, with more than three-quarters coming from the service robotics industry.
By 2029, revenue in the global robotics market is expected to rise to just over $73 billion. This will be over two-fifths (43.7%) more than in 2025 and more than double (+134.7%) compared to 10 years earlier.
Percentage change in global revenue from industrial and service robotics (2019-29) #
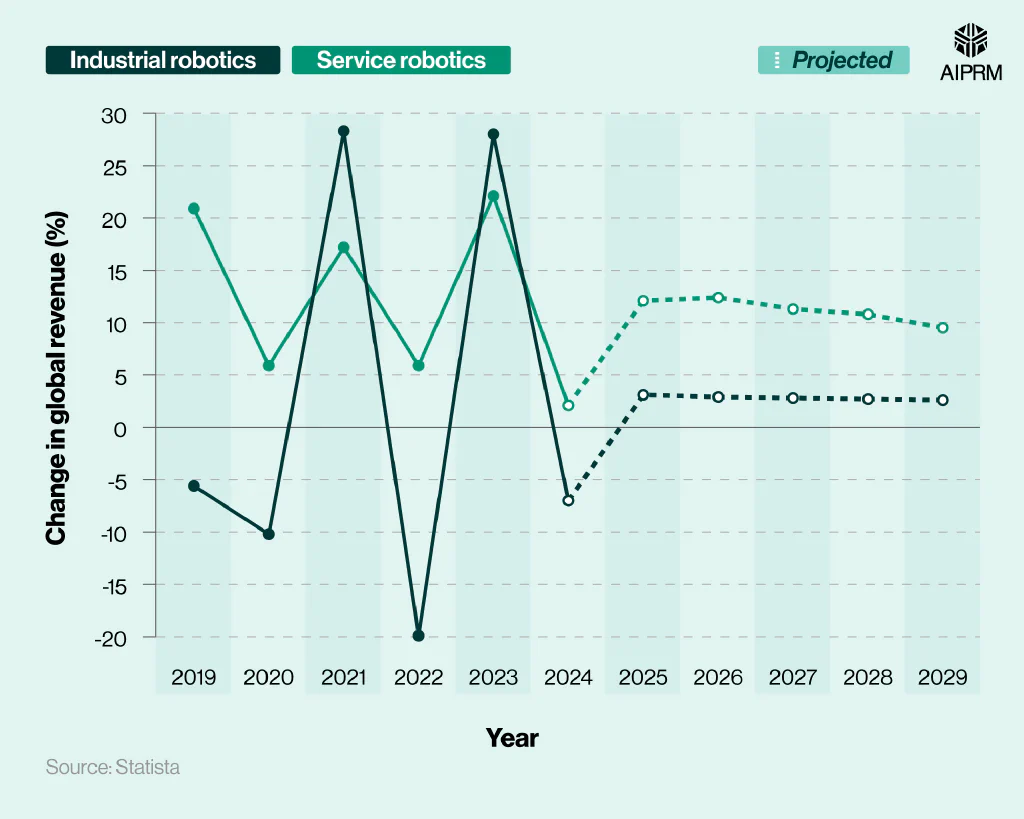
Revenue from the industrial robotics industry witnessed significant fluctuations between 2019 and 2024, rising by more than a quarter (+28.3%) in 2021, yet falling by almost a fifth (-19.9%) the following year.
Contrastingly, revenue from service robotics during this period has been positive, reaching highs of more than a fifth (+22.1%) in 2023 before falling to just +2.1% in 2024 for annual growth.
By 2029, the industrial robotics industry is forecasted to see a 2.6% rise in its global revenue figures YoY, with respective figures anticipated to be almost four times higher in the service robotics sector.
Main market drivers for value change in the robotics industry (2022-23) #
| Market Factor | Value change (%) |
|---|---|
| GDP growth | 3.2 |
| Labor shortage | 1.9 |
| Impact of inflation | 1.4 |
| Aging population | 0.3 |
| Chip shortage | -0.4 |
| Impact of the Russia-Ukraine War | -4.1 |
| Total market growth | 2.3 |
(Source: Statista)
According to robotics market statistics from Statista, the global robotics market grew by an average of 2.3% between 2022 and 2023.
The main reason behind this was overall GDP growth, accounting for a 3.2% rise during this period. This was counteracted by the conflict between Russia and Ukraine, which caused the global robotics industry to shrink by 4.1%; the primary negative factor influencing the overall market.
Another significant positive impact was a global labor shortage, resulting in a 1.9% growth in the global robotics market due to higher demand for robots in the workplace to plug this deficit.
According to AI in the workplace statistics, just over half (51.3%) of companies plan to adopt the use of robots and non-humanoid technology at some point before 2027, meaning this figure could increase further as time goes on.
Global revenue industry share for robotics (2025) #
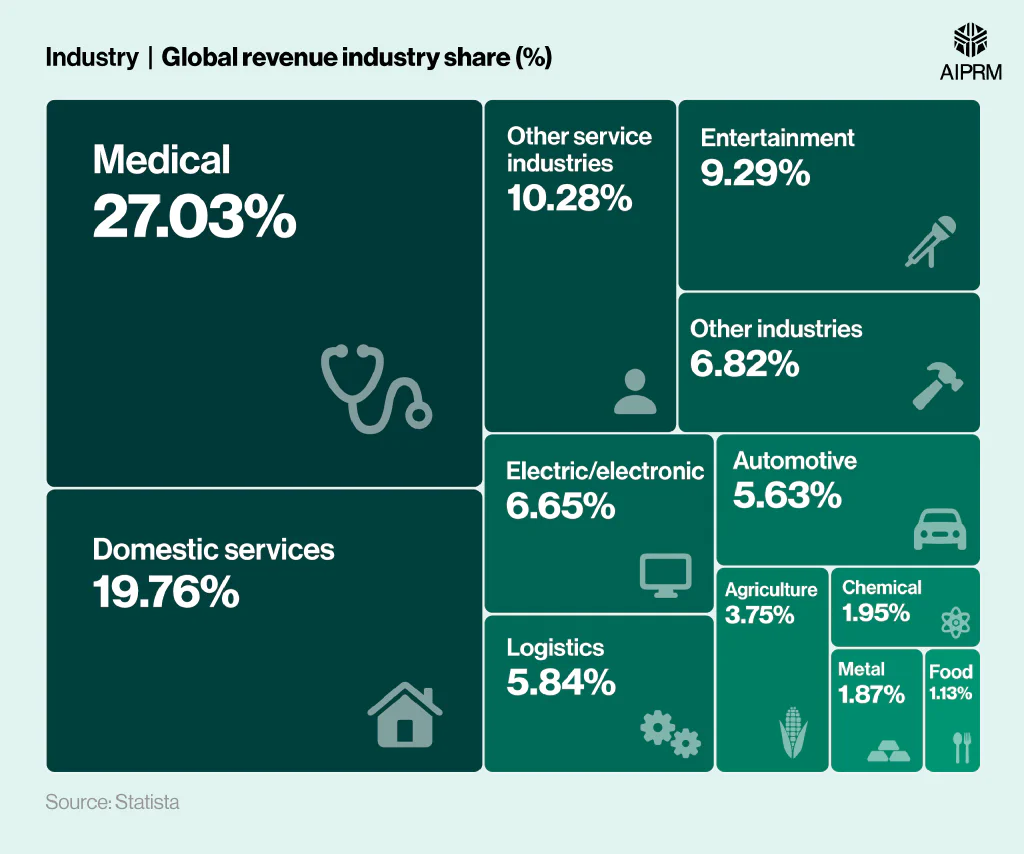
As of 2025, just over a quarter (27.03%) of the global robotics market is projected to be occupied by the medical sector.
Robotics market statistics indicate that domestic services is the second-biggest area, occupying just under a fifth (19.76%) of the overall industry. This was followed by other service industries (10.28%) and entertainment (9.29%), with each accounting for around a tenth of the total.
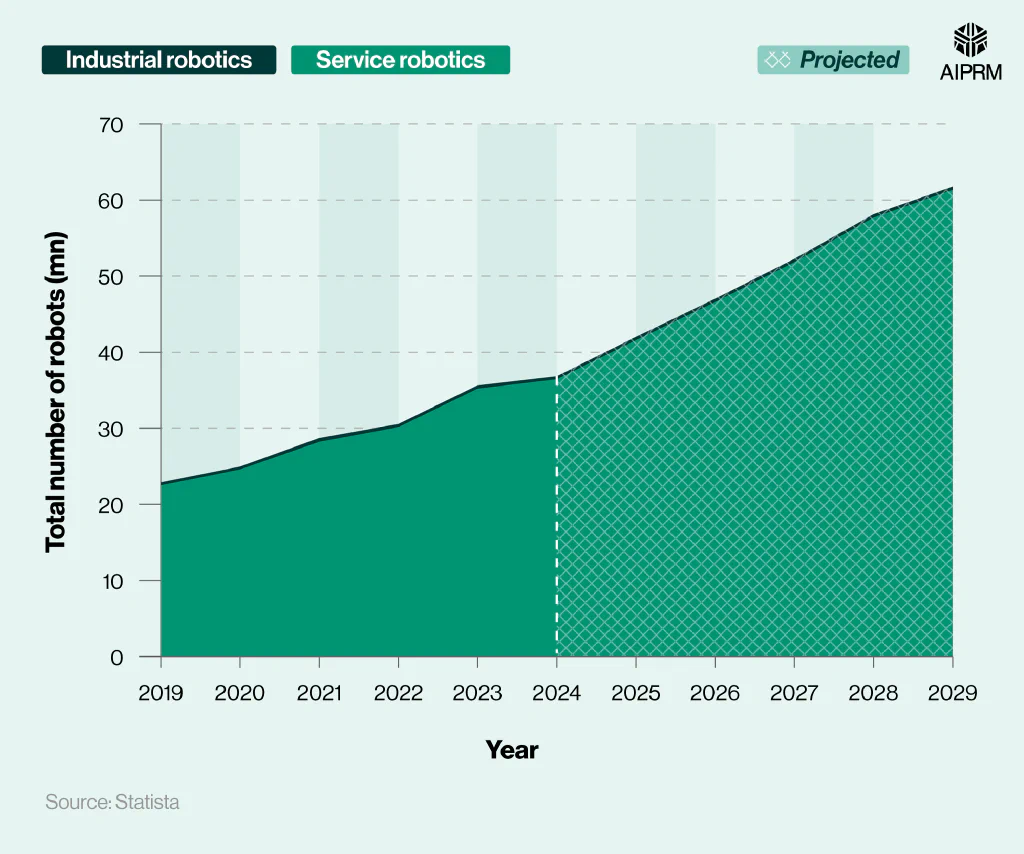
Total number of industrial and service robots around the world (2019-29) #
| Year | Industrial robotics (mn) | Service robotics (mn) |
|---|---|---|
| 2019 | 0.39 | 22.50 |
| 2020 | 0.38 | 24.58 |
| 2021 | 0.50 | 28.21 |
| 2022 | 0.42 | 30.14 |
| 2023 | 0.43 | 35.20 |
| 2024* | 0.40 | 36.43 |
| 2025* | 0.44 | 41.57 |
| 2026* | 0.44 | 46.58 |
| 2027* | 0.44 | 51.82 |
| 2028* | 0.44 | 57.69 |
| 2029* | 0.43 | 61.32 |
(Source: Statista)
*Projected figures
According to robotics data from Statista, approximately 36.83 million robots were in operation globally in 2024. Virtually all of these (98.9%) were service robots.
By 2029, it’s predicted that there could be around 61.75 million robots in use throughout the world. The number of industrial robots in circulation is expected to rise by 7.5% between 2024 and 2029, with the popularity of service robots anticipated to increase by more than two-thirds (68.3%) during the same period.
Did you know that more than half (53%) of EU healthcare organizations planned to use medical robotics by the end of 2024? For facts like this and more, check out the latest AI in healthcare statistics.
Average price per newly installed industrial and service robot (2019-29) #
| Year | Industrial robotics | Service robotics |
|---|---|---|
| 2019 | $23,020 | $8,080 |
| 2020 | $21,370 | $8,310 |
| 2021 | $20,820 | $10,310 |
| 2022 | $19,670 | $10,640 |
| 2023 | $20,420 | $11,110 |
| 2024* | $21,350 | $11,510 |
| 2025* | $22,070 | $11,770 |
| 2026* | $22,700 | $12,170 |
| 2027* | $23,270 | $12,440 |
| 2028* | $23,800 | $12,710 |
| 2029* | $24,690 | $13,260 |
(Source: Statista)
*Projected figures
In terms of the average cost per newly installed robot, there are some significant variations between those in an industrial setting and those used in service robotics.
As of 2024, the average price of a service robot stood at $11,510, which is around half the amount of a new industrial robot ($21,350).
Fast forward to 2029, and the typical cost of these new installations is expected to rise by over a seventh (15.2%) for service robots and those in the industrial sector (15.6%).
Interestingly, between 2019 and 2029, the average price for service robotics is predicted to see growth from just over $8,000 to $13,260 for a typical robot – a rise of almost two-thirds (64.1%) over the decade.
In contrast to this, the average cost of an industrial robot during this period is expected to fluctuate from a little over $23,000 in 2019 to $24,690 in 2029 – an overall increase of 7.3% in the space of 10 years.
North America robotics market #
According to IFR robotics statistics, the North American robotics market comprised 49,000 robots as of 2022, based on preliminary results. This represented a rise of 8.9% in just 12 months.
Number of industrial robots installed in North America per year (2012-22) #
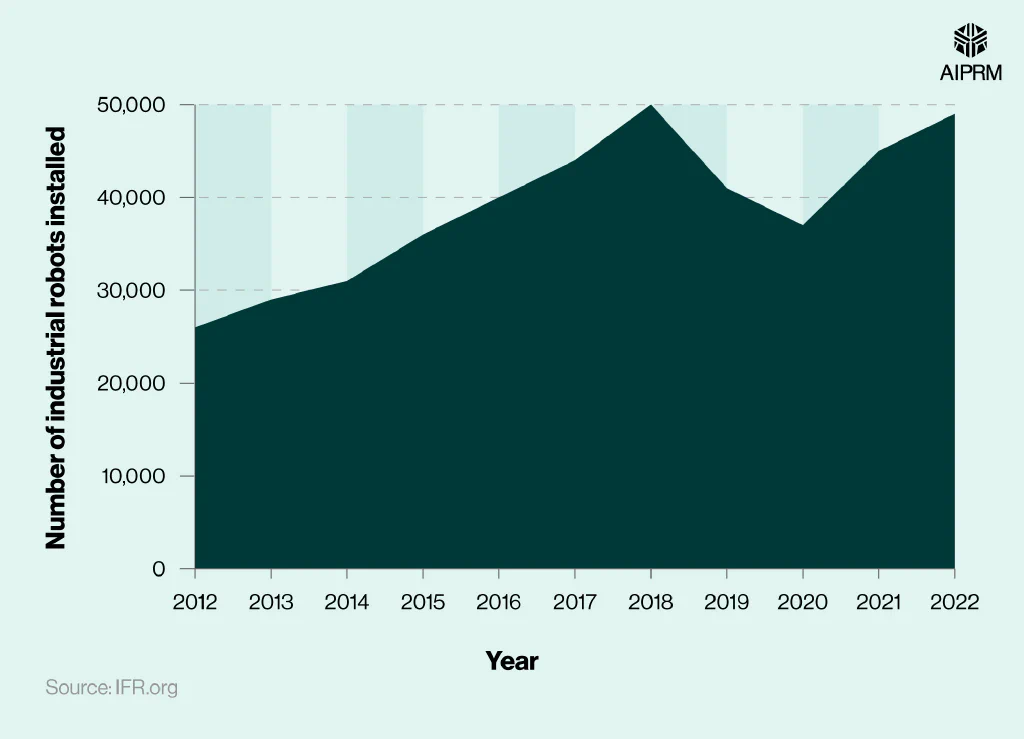
Since 2012, the number of robots across North America has generally risen YoY, almost doubling between 2012 and 2018 from 26,000 to a peak of 50,000.
Number of industrial robots installed across selected industries in the United States (2021-23) #
| Year | Automotive | Electrical/electronics | Metal and machinery | Plastic and chemical products | Food |
|---|---|---|---|---|---|
| 2021 | 9,854 | 2,963 | 4,193 | 3,631 | 3,443 |
| 2022 | 14,472 | 3,732 | 3,900 | 3,065 | 2,442 |
| 2023 | 14,678 | 5,120 | 4,123 | 3,213 | 1,982 |
(Source: IFR.org)
As of 2023, there were approximately 14,678 industrial robots in operation across the US in the automotive industry. This accounted for just under a third (30%) of all robots within the continent, and the most common industry in North America to use robotics.
This was followed by electrical/electronics at 5,120 (just over 10% of the total) for the year.
Number of industrial robots installed in selected North American countries per year (2013-23) #
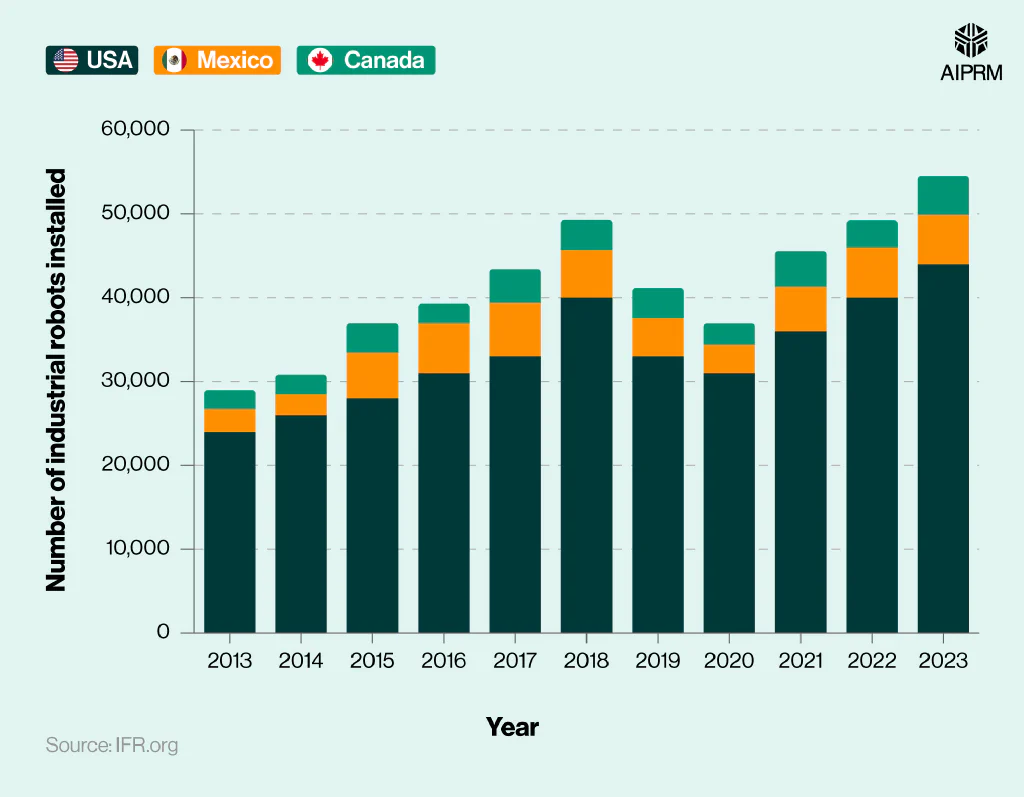
| Year | US | Mexico | Canada |
|---|---|---|---|
| 2013 | 24,000 | 2,739 | 2,250 |
| 2014 | 26,000 | 2,494 | 2,333 |
| 2015 | 28,000 | 5,466 | 3,474 |
| 2016 | 31,000 | 5,933 | 2,334 |
| 2017 | 33,000 | 6,356 | 4,057 |
| 2018 | 40,000 | 5,681 | 3,582 |
| 2019 | 33,000 | 4,562 | 3,603 |
| 2020 | 31,000 | 3,363 | 2,566 |
| 2021 | 36,000 | 5,319 | 4,239 |
| 2022 | 40,000 | 6,000 | 3,223 |
| 2023 | 44,000 | 5,868 | 4,616 |
(Source: IFR.org)
The North American robotics market is largely dominated by three main countries (the US, Mexico, and Canada). In 2023, an IFR robotics statistics report signified that the bulk of industrial robots in North America were located in the US (44,000), representing around 80% of the total.
By 2023, there were nearly twice as many industrial robots in the US compared to 2013 – a growth trend largely mirrored in both Mexico and Canada. By 2023, Mexico had around 5,868 industrial robots in operation, around 27% more than Canada by comparison.
Asia Pacific industrial robotics market #
For 2025, projected revenue from the Asia Pacific industrial robotics market was $4.26 billion. If correct, this will represent a rise of nearly 2% from 2024 and mean the industry will have generated 18% more revenue than in 2019.
Annual robotics revenue ($bn) in Asia over time (2019-29) #

By 2029, total revenue from the Asia Pacific robotics market could reach $4.58 billion, marking a rise of almost 10% in the space of five years from 2024.
Which industries have the most industrial robots installed in Asia? #
According to our analysis of robotics statistics, around 99,800 industrial robots were projected to be installed in the electric and electronics industry across the Asia Pacific region in 2024. Although this represents a fall of nearly 29% from 2021, electronics remains the industry with the highest number of industrial robot installations in Asia.
The number of industrial robot installations in the Asian electronics industry is projected to decline further in the following years, falling below 88,000 in 2028.
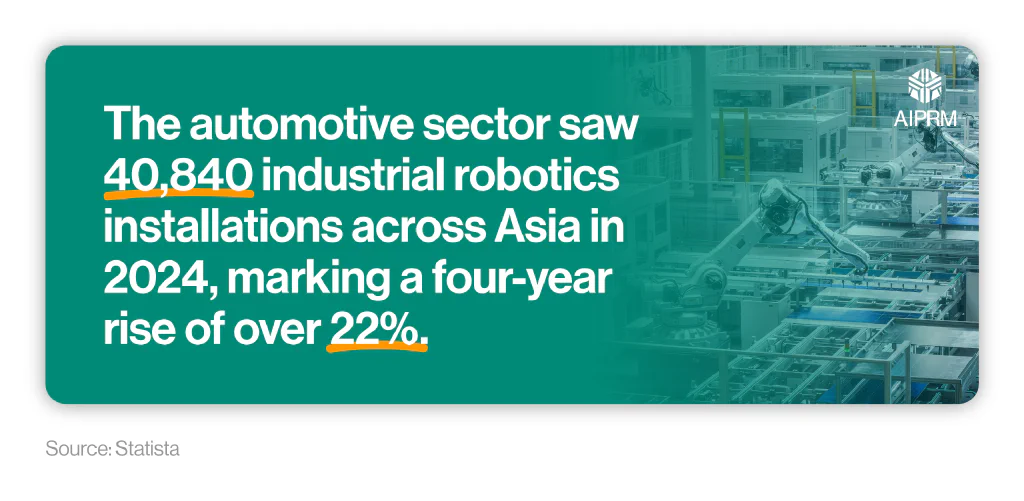
The automotive sector saw 40,840 industrial robotics installations across Asia in 2024, marking a four-year rise of over 22%. Installations are expected to decrease from 2025 onwards, falling to 30,720 by 2029.
If correct, then industrial robotic installations in the Asian automotive industry will drop by 24.8% between 2024 and 2029.
Average price per newly installed industry robot in Asia over time (2019-29) #
| Year | Average cost ($) |
|---|---|
| 2019 | 15,250 |
| 2020 | 14,630 |
| 2021 | 15,690 |
| 2022 | 15,230 |
| 2023 | 15,520 |
| 2024* | 15,980 |
| 2025* | 16,330 |
| 2026* | 16,640 |
| 2027* | 16,920 |
| 2028* | 17,230 |
| 2029* | 17,970 |
(Source: Statista)
*Projected figures
The average price per newly installed industry robot across Asia stood at $15,980 as of 2024. By 2029, this figure is expected to rise by around 12.5% to $17,970 per robot.
Robotics statistics in China #
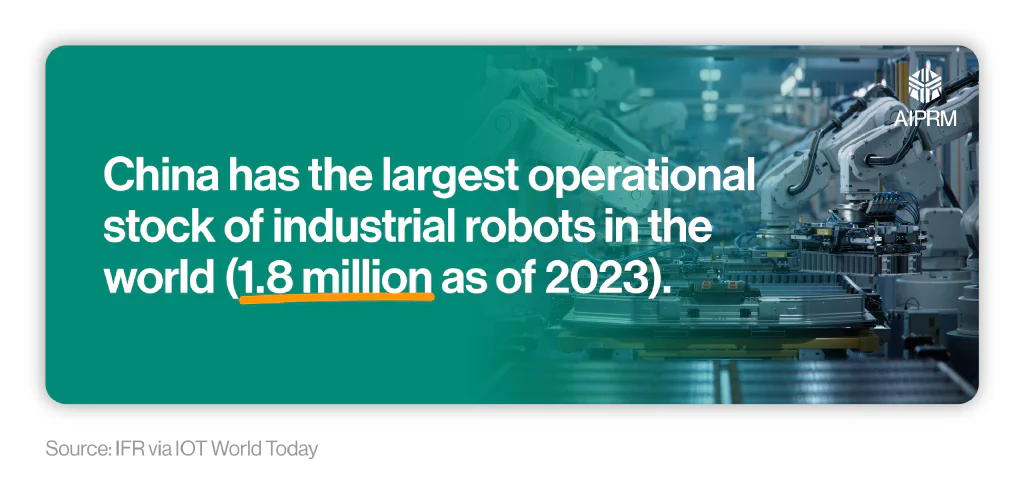
A large proportion of Asia Pacific’s growth can be attributed to China’s rapid development in the world of robotics. Its operational stock was almost 1.8 million in 2023, making it the first and only country in the world with such large reported figures.
In 2023 alone, there were over 250,000 robotic units installed throughout the country, representing just over half (51%) of the total global market share. The vast majority of robots produced in China serve the domestic market, with less than 5% exported abroad.
To serve this demand, production plants have been established across China, allowing it to become the world’s largest car market and production base for cars. It has also become a major producer of electronic devices, batteries, semiconductors, and microchips. So much so that in 2016, the electrical and electronics industry replaced automotives as the main customer and driver of industrial robots in China.
Robotics statistics in Japan #
According to recent reports from the IFR, Japan faced a labor shortage in 2024. The world’s largest robot manufacturing country is developing a series of automation strategies that will allow it to streamline logistical issues and address the challenges brought about by new national working time legislation.
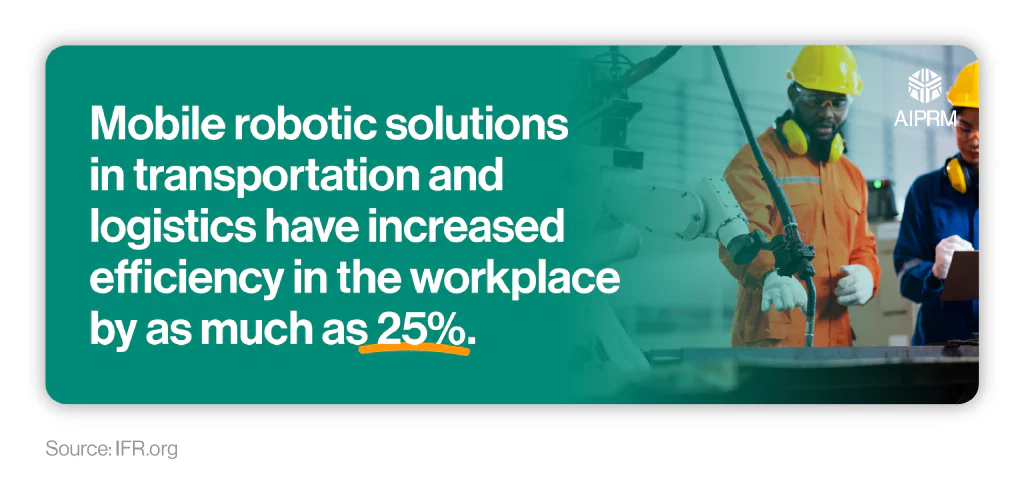
The typical annual working hours in Japan for a heavy truck driver in 2022 stood at 2,568 hours – 444 hours more than the national average for all jobs. Loading and unloading cargo from trucks and warehouses is one of the most time-consuming tasks of truck drivers. Therefore, mobile robotic solutions in transportation and logistics have been introduced to help make this role more efficient and save up to a quarter (25%) of the working time during each shift.
As a result, sales of service robots for transportation and logistics grew by more than two-fifths (44%) in 2022, with more than 86,000 units sold worldwide.
In 2023, the overall operational stock of Japanese robots reached 435,000 – up 5% from 2022 and nearly 11% higher than in 2021.
Robotics statistics in India #
In 2023, sales of industrial robots reached a new record of 8,510 units – an increase of almost three-fifths (59%) compared to the previous year. This means that within five years, the operational stock of industrial robots almost doubled, reaching 44,958 units in 2023. This represents an average growth of 14% per year since 2018.
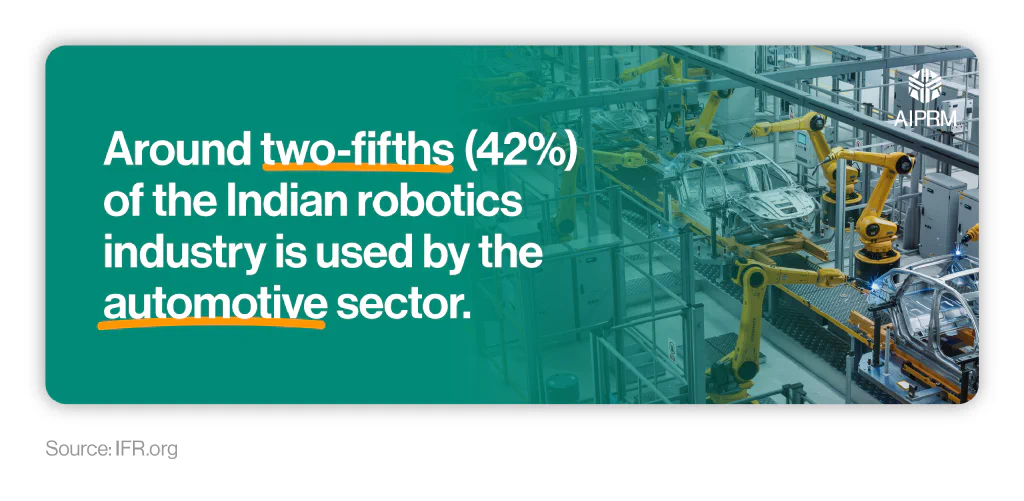
The automotive sector occupies the largest market share of the Indian robotics industry at just over two-fifths (42%) as of 2023, with the number of installations more than doubling between 2022 and 2023 to 3,551 (+139%).
Industrial robotics market in Europe #
According to the latest robotics statistics from the IFR, the number of industrial robots in Europe is rising, with over 92,000 units installed in 2023 – up 9% YoY. Around half (49%) of these are attributed to three countries: Germany, Italy, and France.
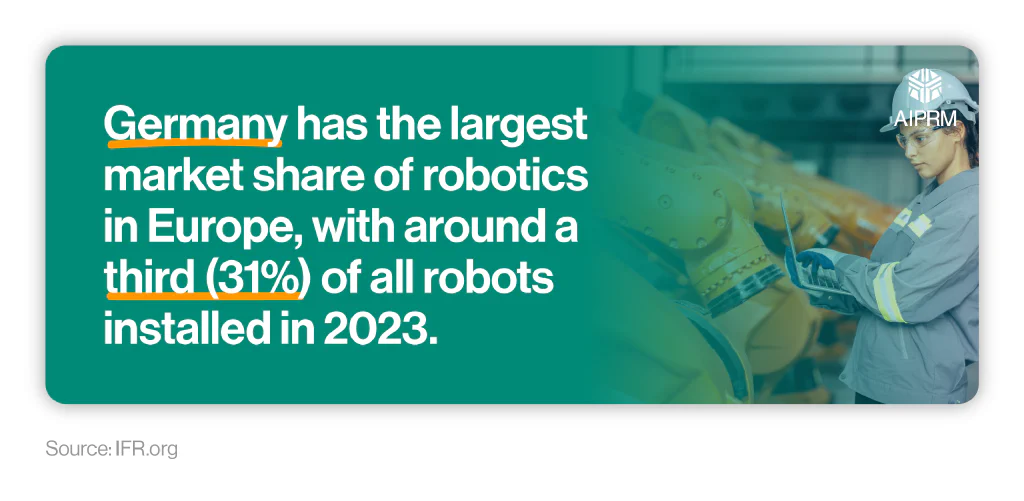
Germany had the largest market share of European industrial robotics in 2023, accounting for almost a third (31%) of those installed in the EU throughout the year (28,355). This made it the fifth-largest market worldwide for 2023, behind China, Japan, the United States, and the Republic of Korea.
The automotive industry was a key consumer of industrial robots in Germany in 2023, responsible for nearly a third (32.4%) of all newly installed robots in the whole of Europe. This represented almost 9,200 units – a rise of over a fifth (29%) from 2022.
European robotics revenue #
According to an analysis of European robotics statistics, the projected annual robotics revenue across the continent stood at approximately $4.18 billion in 2024 – a rise of around 1.5% in five years.
However, this represents a fall of over 13% from 2023, when European robotics revenue stood at $4.82 billion.
Annual robotics revenue ($bn) in Europe over time (2019-29) #
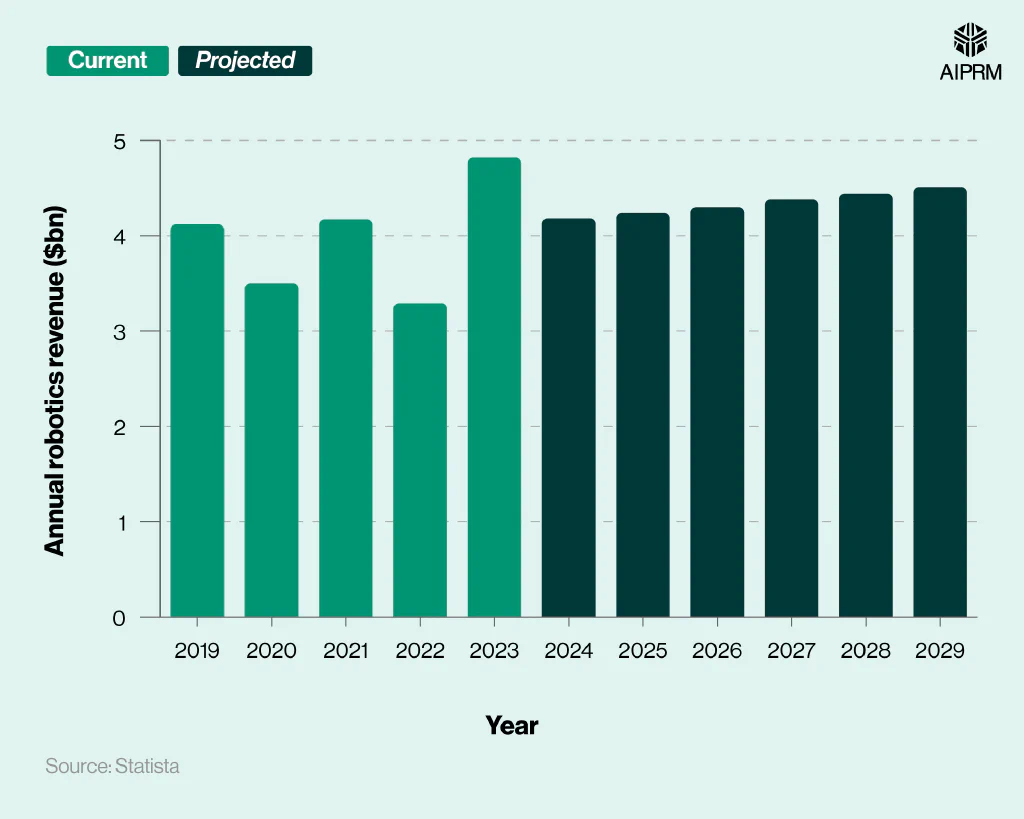
Steady growth in the second half of the decade is projected to take industry revenue to $4.51 billion by 2029. If correct, this will mark a five-year rise of 7.9% and represent the highest revenue total for the European robotics market since 2023.
Which industries have the most industrial robots installed in Europe? #
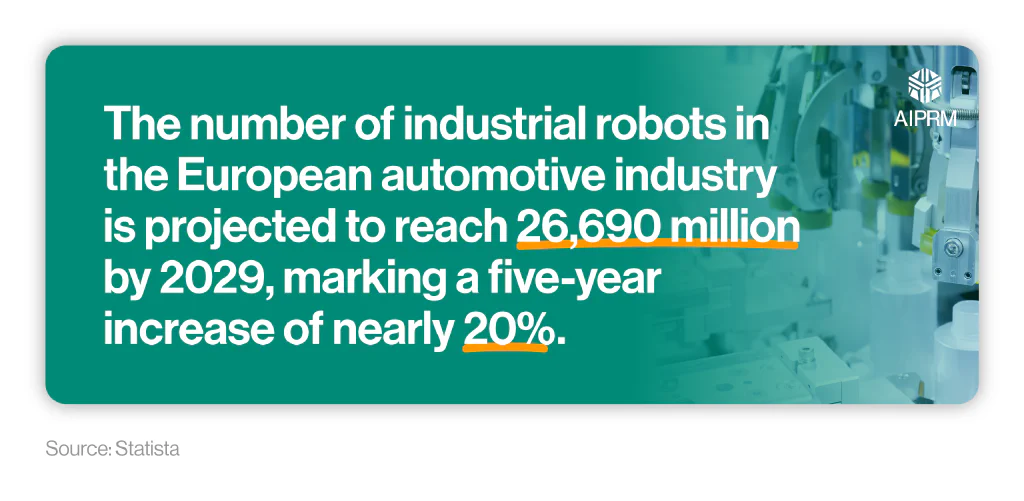
As of 2024, there were around 22,270 industrial robots in the automotive industry across Europe. While this represented a fall from the previous year, it made the automotive industry the largest individual sector in Europe for industrial robot installations.
By 2029, it’s projected that the number of industrial robots in the European automotive industry will reach 26,690, marking a five-year increase of nearly 20%.
Over the same period, the number of industrial robots in Europe’s electrical and electronics industry is projected to rise by over 17%, from 12,180 in 2024 to 14,260 in 2029.
Average price per newly installed industry robot in Europe over time (2019-29) #
| Year | Average cost ($) |
|---|---|
| 2019 | $54,240 |
| 2020 | $48,550 |
| 2021 | $48,060 |
| 2022 | $40,100 |
| 2023 | $44,690 |
| 2024* | $46,650 |
| 2025* | $48,380 |
| 2026* | $49,610 |
| 2027* | $50,860 |
| 2028* | $51,760 |
| 2029* | $50,560 |
(Source: Statista)
*Projected figures
Between 2019 and 2024, there were fluctuations in the average cost for a European industrial robot, from a low of $40,100 in 2022 to a high of $54,240 in 2019. This was largely down to inflationary pressures in late 2022 that saw inflation reach levels not seen since the 1980s. Coupled with a tight labor market and supply chain issues, these compounding factors can be attributed to an associated rise in the average price of robotics for 2024 and beyond.
As of 2024, the industrial robotics market in Europe yielded an average cost of $46,650 per robot – a drop of almost a seventh (14%) from 2019.
By 2029, the average price of an industrial robot in Europe is anticipated to rise to around $50,560 (or 8.4% more than the typical cost in 2024).
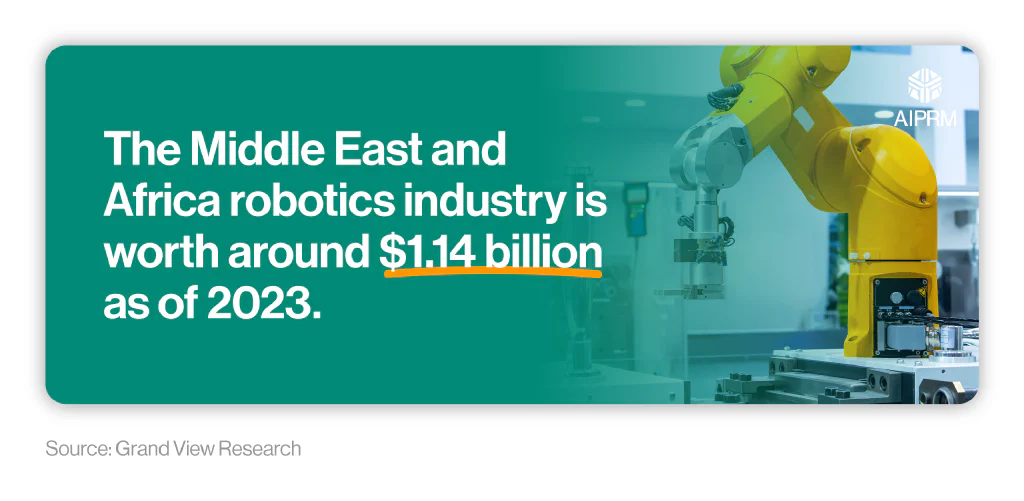
Robotics market in the Middle East and Africa #
The industrial robotics market in the Middle East and Africa is predicted to reach a projected revenue of $4.29 billion by 2030, at a CAGR of nearly a fifth (19.1%) between 2025 and 2030.
As of 2023, the amount of money generated from industrial robots across the Middle East and Africa exceeded $1.14 billion.
Rising industrialization, economic development, and the drive for efficient manufacturing processes have resulted in an expanding industrial robotics market within the region. Saudi Arabia announced plans in early 2023 to increase the number of factories to 36,000 by 2035. More than 4,000 of these will produce autonomous vehicles for the country’s first electric car brand.
In total, it’s expected this will contribute more than $135.2 billion to Saudi Arabia’s economy by 2030 (or 12.4% of the nation’s GDP).
Similarly, Dubai announced its Robotics and Automation Program in 2023, involving the deployment of 200,000 robots within a decade to boost production and efficiency across multiple industries, including logistics and precision manufacturing.
South America robotics market #
As of 2024, the South American robotics market was projected to generate $783.2 million in revenue, with the vast majority coming from service robotics. This represents a rise of over half (58.5%) from 2019.
Annual robotics revenue ($mn) across South America over time (2019-29) #
By 2029, revenue from the South American robotics market is projected to total $850.3 million. This is an increase of almost 9% (8.6%) from 2024, with most of this income once again from service robots.
Projected revenue share of robotics in South America by industry (2025) #

In terms of revenue share by industry, the South American robotics market is largely dominated by the medical sector, which is projected to account for over a quarter (27.92%) of all revenue during 2025.
This is followed by domestic services at just over a fifth (21.3%) and agriculture at around a sixth (17.03%).
In total, around two-thirds (66.25%) of the South American robotics market is attributed to these three industries combined.
Total number of industrial and service robots across South America over time (2019-29) #

As of 2024, there were 578,170 robots in operation across South America, with the overwhelming majority of these (96%) being service robots. This represents a rise of more than two-thirds (67.5%) from 2019.
By 2029, the number of robots in South America is expected to fall to 513,470, a drop of 11.2% over five years.
Average price per newly installed industry and service robot in South America over time (2019-29) #
| Year | Industrial robots | Service robots |
|---|---|---|
| 2019 | $6,410 | $6,020 |
| 2020 | $6,130 | $3,990 |
| 2021 | $3,890 | $5,630 |
| 2022 | $3,580 | $6,070 |
| 2023 | $3,510 | $6,140 |
| 2024* | $3,300 | $6,020 |
| 2025* | $3,190 | $5,960 |
| 2026* | $3,120 | $6,110 |
| 2027* | $3,100 | $6,220 |
| 2028* | $3,080 | $6,330 |
| 2029* | $2,790 | $5,960 |
(Source: Statista)
*Projected figures
The average cost of a newly installed robot in South America in 2024 was $3,300 for industrial robots and almost double ($6,020) for a typical service robot.
Since 2019, the average price of an industrial robot in South America has almost halved (-48.5%), whereas the comparative cost of a service robot has broadly stayed the same.
The average cost of South American robots in both categories is expected to fall to $2,790 for industrial robotics and $5,960 for service robots by 2029.
Robot density statistics #
As of 2022, the worldwide average for robot density in the manufacturing industry was 151 per 10,000 employees. Analysis of these robotics statistics on a continental level indicates that Asia has the highest density of robots at 168 per 10,000 workers, followed by Europe (136) and the Americas (120).
Number of installed robots per 10,000 employees in the manufacturing industry (2017 vs. 2022) #
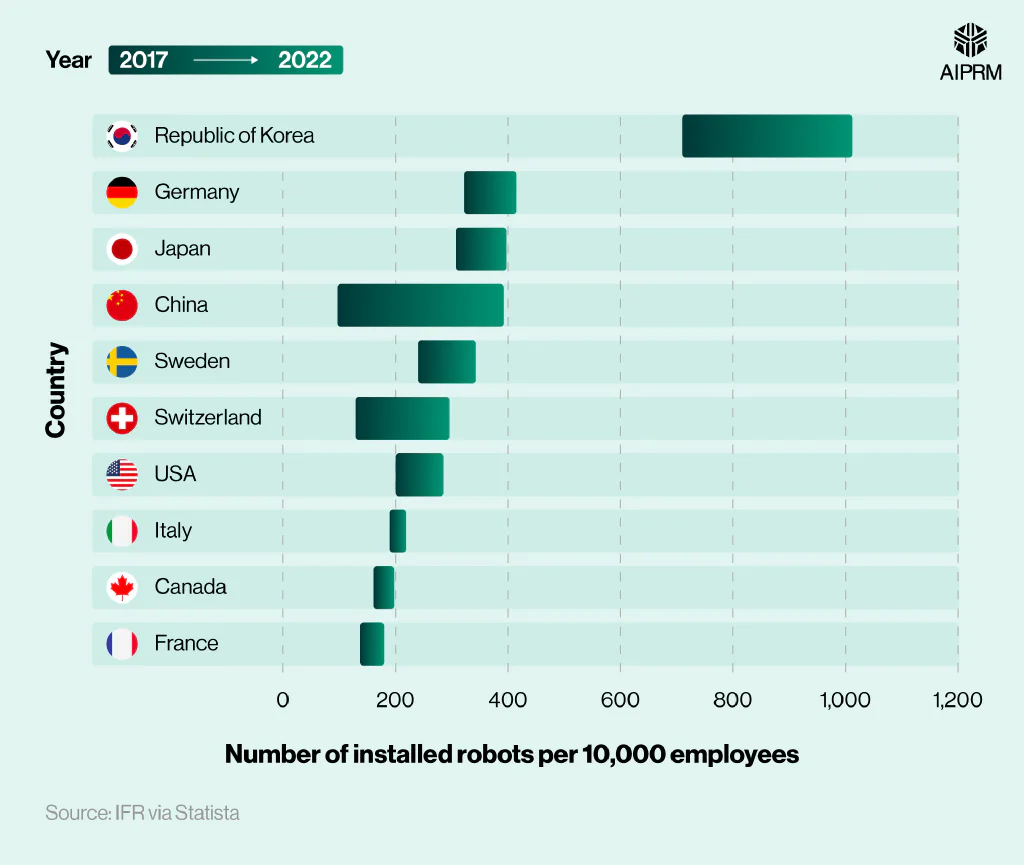
On a country level, the Republic of Korea has the highest robot density in the world, with an average of 1,012 robots per 10,000 employees. This is around two-and-a-half times more than Germany (415), Japan (397), and China (392).
Between 2017 and 2022, China saw the largest growth in its robot density statistics across all nations analyzed in the IFR study. During this time, its average robot density more than quadrupled from 97 to 392 per 10,000 workers. During this time, Switzerland’s robot density also more than doubled to 296 robots per 10,000 employees.
Number of installed robots per 10,000 employees in the manufacturing industry for selected countries (2022) #
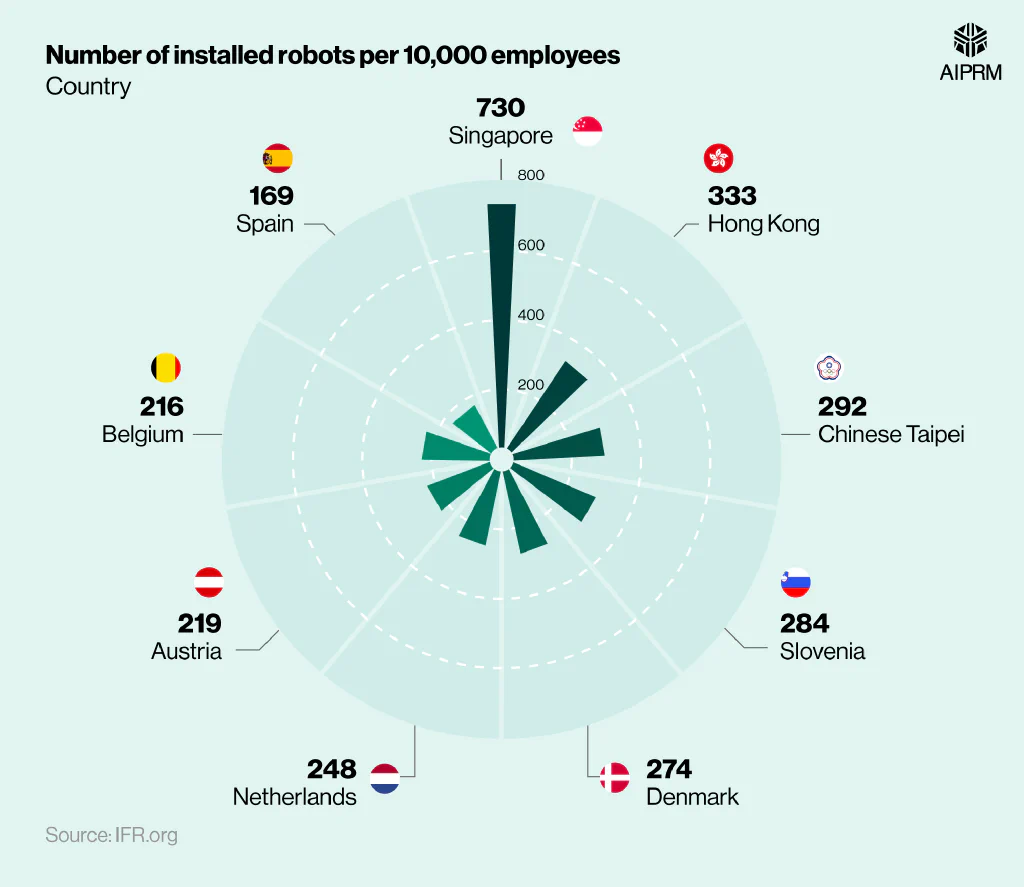
Singapore had the second-highest robot density of all countries in 2022. With roughly 730 robots per 10,000 employees, this is more than twice the amount compared to Hong Kong and 2.5 times the total for Chinese Taipei.
Job market for robotic engineers #
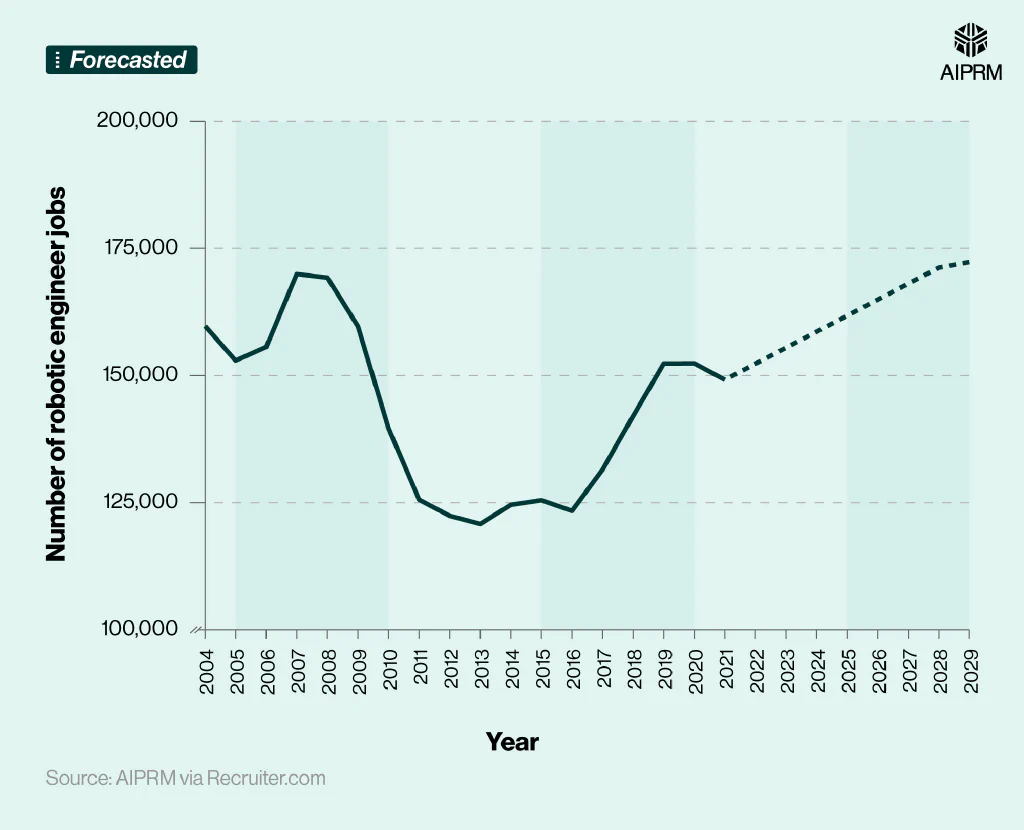
As of 2025, there are estimated to be 161,766 robotic engineer jobs in the US – a rise of over 6% from 2020.
Between 2004 and 2020, there were significant fluctuations in the number of US robotic engineering jobs. This peaked at almost 169,950 in 2007, yet fell YoY to 120,820 in 2013 before rising consistently until 2020.
Total number of robotic engineer jobs in the US over time (2004-29) #
| Year | Number of robotic engineer jobs |
|---|---|
| 2004 | 159,720 |
| 2005 | 152,940 |
| 2006 | 155,620 |
| 2007 | 169,950 |
| 2008 | 169,240 |
| 2009 | 159,670 |
| 2010 | 139,600 |
| 2011 | 125,590 |
| 2012 | 122,410 |
| 2013 | 120,820 |
| 2014 | 124,570 |
| 2015 | 125,470 |
| 2016 | 123,390 |
| 2017 | 131,510 |
| 2018 | 142,030 |
| 2019 | 152,340 |
| 2020 | 152,380 |
| 2021* | 149,167 |
| 2022* | 152,317 |
| 2023* | 155,466 |
| 2024* | 158,616 |
| 2025* | 161,766 |
| 2026* | 164,915 |
| 2027* | 168,065 |
| 2028* | 171,214 |
| 2029 | 172,300 |
(Source: AIPRM via Recruiter.com)
*Projected figures
By 2029, it’s predicted there could be as many as 172,300 robotics engineering jobs in the US – 8.6% more than in 2024 and about two-fifths more (42.6%) compared to the low of 2013.
Statistics on job creation and labor shortages in the robotics industry #
According to robotics statistics from the IFR, there are many ways in which robots can create new job opportunities and fight labor shortages around the world as manufacturers struggle to fill vacancies.
In 2023, more than a quarter (26%) of European manufacturing businesses witnessed a reduction in production due to a shortage of workers compared to only 7% in 2012. In the US alone, around 616,000 manufacturing job openings were not filled in August 2023, highlighting the extent of the issue across the country.
It’s estimated that by 2030, a lack of skilled labor could lead to 2.1 million unfilled manufacturing positions in the US.
While robots cannot and should not replace the entire human workforce, they have the potential to transform traditional manufacturing roles over the coming decade. The IFR predicts that by 2034, more than half of manufacturing operators will be working with robots in some capacity.
Number of robotic engineer jobs in the US per state (2024) #
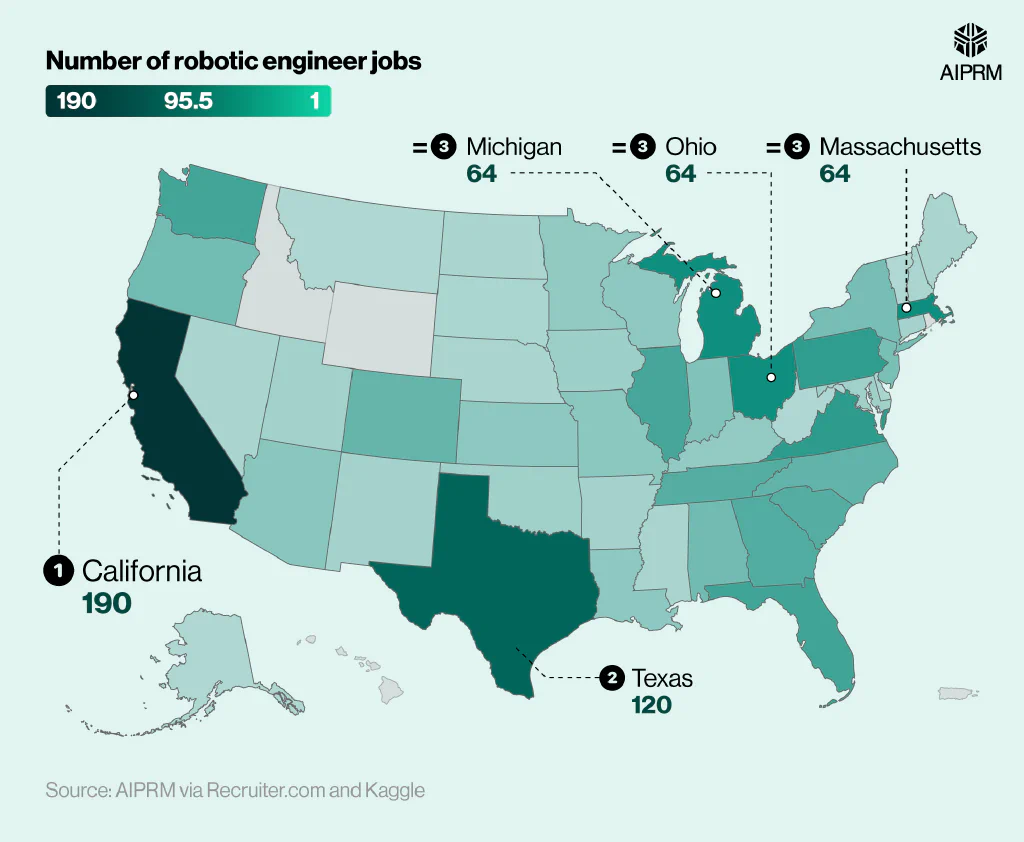
The majority of robotic engineer jobs in the US tend to be located in California, with 190 job postings in 2024. This was around 60% more than Texas in second place and almost three times the amount compared to Michigan, Ohio, or Massachusetts.
In fact, there were almost the same number of robotic engineer job vacancies in these three states combined (192) as there were in California alone (190).
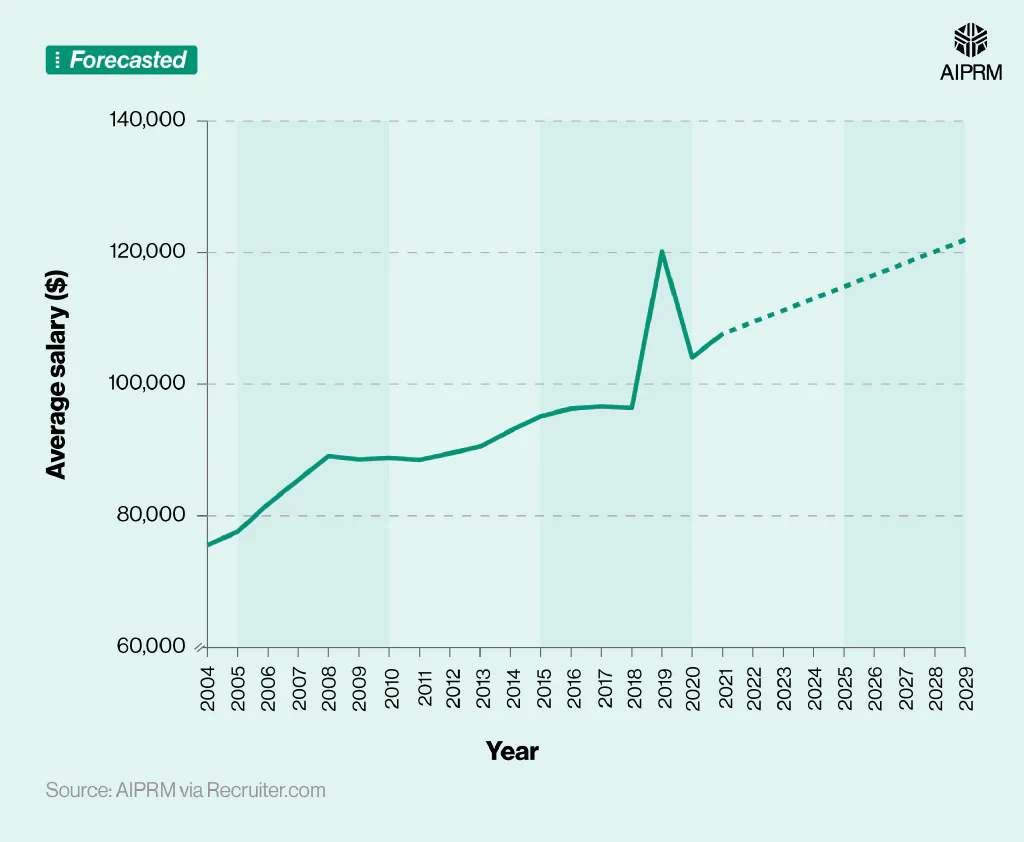
Robotics average salary #
As of 2025, a robotics engineer’s average salary is predicted to be around $114,789 a year, indicating a rise of roughly 10.3% from 2020.
Average robotics engineer salary in the US over time (2004-29) #
| Year | Average salary ($) |
|---|---|
| 2004 | 75,540 |
| 2005 | 77,570 |
| 2006 | 81,750 |
| 2007 | 85,430 |
| 2008 | 89,080 |
| 2009 | 88,570 |
| 2010 | 88,800 |
| 2011 | 88,500 |
| 2012 | 89,480 |
| 2013 | 90,500 |
| 2014 | 92,920 |
| 2015 | 95,120 |
| 2016 | 96,290 |
| 2017 | 96,580 |
| 2018 | 96,380 |
| 2019 | 120,150 |
| 2020 | 104,080 |
| 2021* | 107,646 |
| 2022* | 109,432 |
| 2023* | 111,218 |
| 2024* | 113,004 |
| 2025* | 114,789 |
| 2026* | 116,575 |
| 2027* | 118,361 |
| 2028* | 120,147 |
| 2029* | 121,933 |
(Source: AIPRM via Recruiter.com)
*Projected figures
The average salary of a robotics engineer generally increased YoY between 2004 and 2020, rising by almost two-fifths (37.8%) during this period.
If current trends continue, the average salary for robotics engineers in the US could reach $121,933 by 2029 – around 6.2% more than the figure for 2025.
Average robotics engineer salary by US state #
According to AIPRM’s analysis of robotics data, the highest average salary for a robotics engineer in 2023-24 was found in New York at approximately $141,732 per year. This was followed closely by California ($140,329) and the District of Columbia ($138,606).
Average robotics engineer salary by US state (2023-24) #
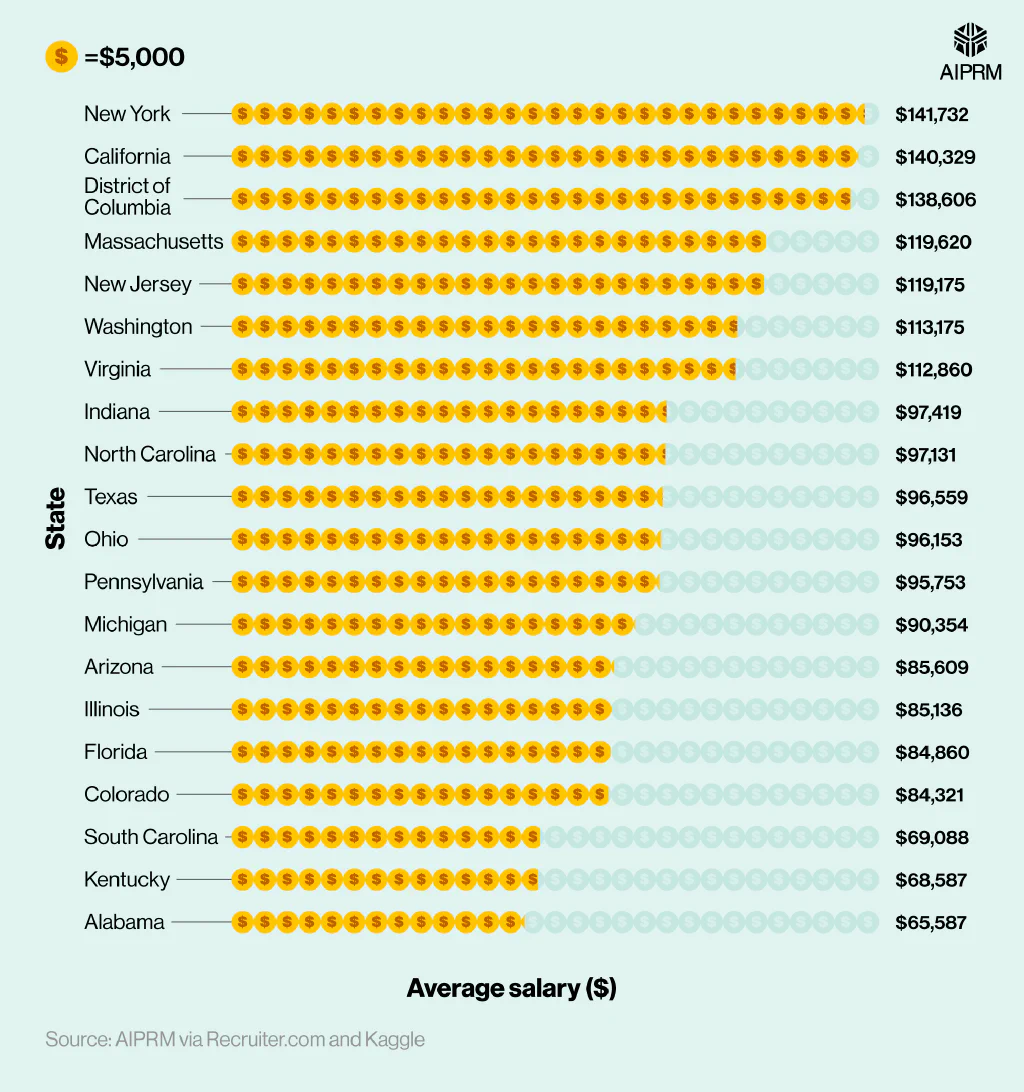
Incidentally, Alabama ranks as one of the states with a lower average salary for a robotics engineer. With typical pay coming out at $65,587 per year, this is around half the amount that an average robotics engineer could expect to earn in New York or California.
Average robotics engineer salary by job level (2023-24) #
| Job level | Average salary ($) |
|---|---|
| Director | $171,643 |
| Mid-senior level | $124,985 |
| Entry level | $94,642 |
| Associate | $91,711 |
| Internship | $69,396 |
(Source: AIPRM via Kaggle)
The average salary of a robotics engineer director in the US stood at $171,643 in 2023-24. This is around a third (37.3%) more than those working at a mid-senior level and almost twice as much as those employed at entry level.
Those working as a robotics engineer intern typically have the lowest yearly average salary at $69,396, over $100,000 less than a director.
Average robotics engineer salary by contract type (2023-24) #
| Work type | Average salary ($) |
|---|---|
| Full-time | $116,406 |
| Contract | $106,705 |
| Internship | $79,584 |
| Part-time | $70,637 |
(Source: AIPRM via Kaggle)
The average robotics engineer salary for full-time employees in the US was around $116,406 as of 2023-24. This was almost $10,000 a year more than those typically employed on a contractual basis and nearly $37,000 more than the average robotics engineer working as an intern.
Those employed as part-time robotics engineers in the US tend to have the lowest average salary at $70,637 a year.
The most common attributes required for a robotics engineer #
When it comes to job listings for robotics engineers in the US, the most common skills and attributes required to fulfill the position include support, process, and skill – each mentioned more than 2,000 times across the job adverts analyzed by AIPRM.
Most common skills and attributes outlined in job descriptions for robotic engineers (2023-24) #
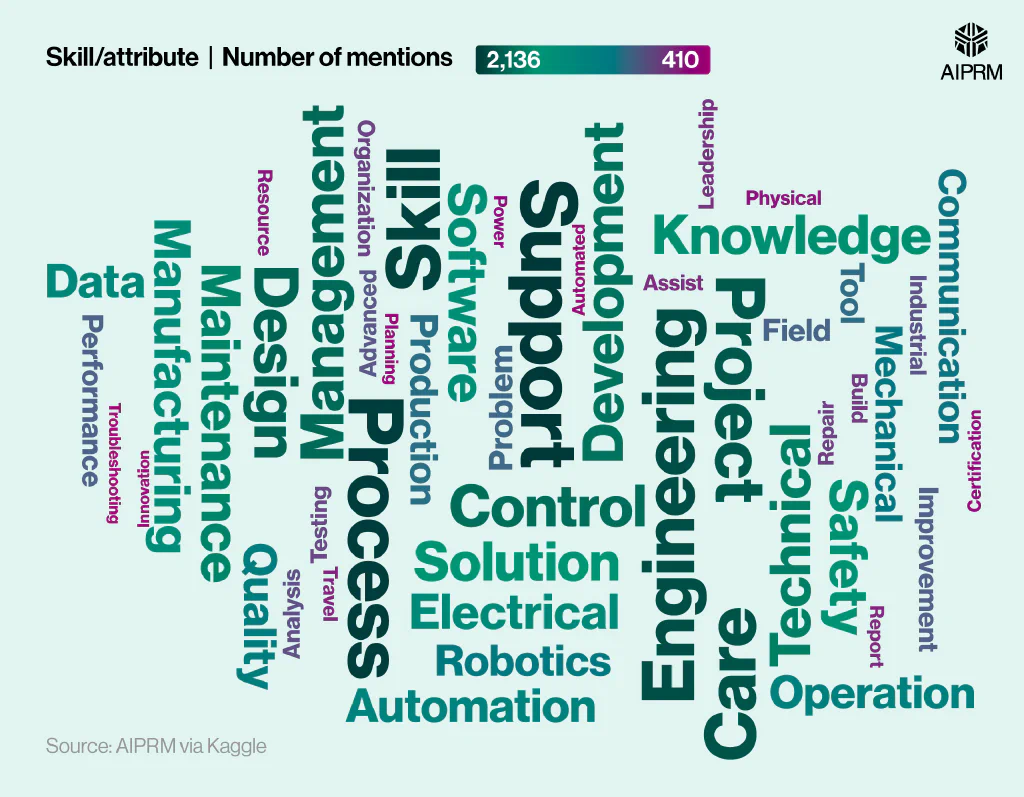
Other keywords used frequently across robotic engineering job adverts include care (1,911 mentions), project (1,800), and design (1,566).
This highlights the methodical thinking, precision, and creativity required to become a robotics engineer.
Robotics usage statistics #
The IFR estimates that the ratio of robots to humans is around 1:71 across the global manufacturing industry, equating to roughly one robot for every 71 humans in the workplace.
Robot usage in manufacturing is primarily implemented for palletization and packaging (83%), but other common applications of this technology include:
- Ground movements and material handling (82%)
- Goods receiving and storage (80%)
- Material handling and forklifts (77%)
- Sorting (75%)
As of 2025, robots will be implemented to manufacture 75% of global vehicles.
However, robots are not just being used in the workplace but also for a range of personal and domestic purposes.
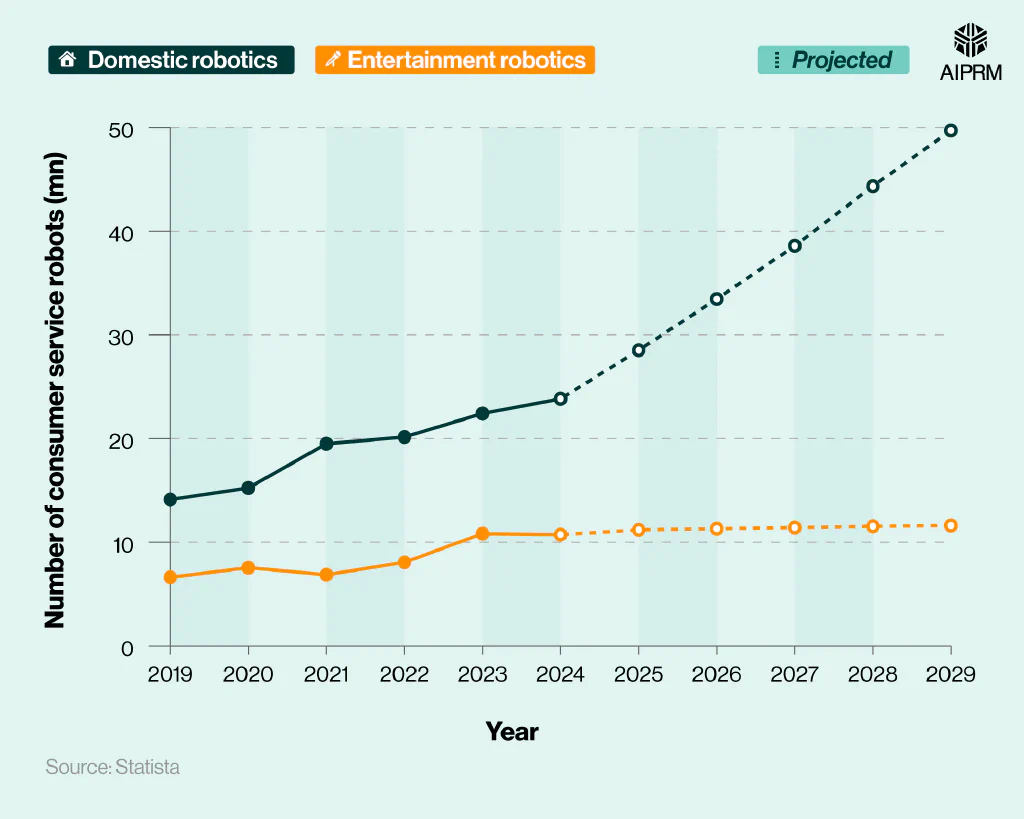
Number of personal and domestic service robot shipments around the world (2018-23) #
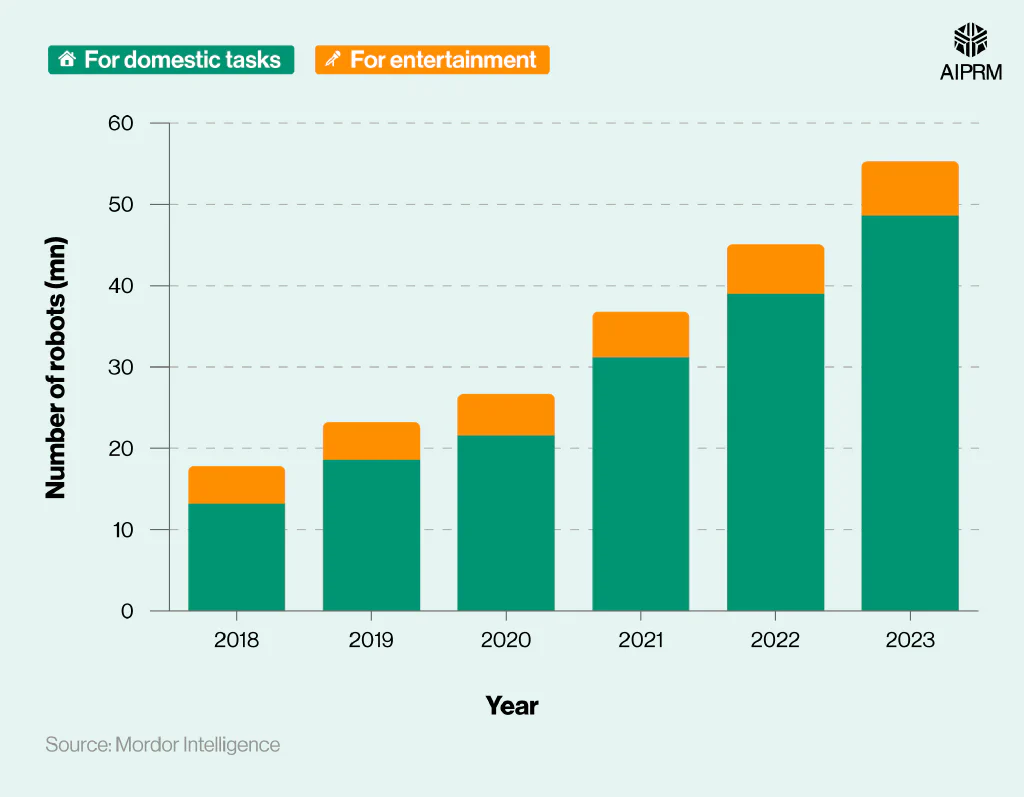
As of 2023, there were approximately 48.6 million domestic service robots around the world, around seven times more than the number of personal robots used for entertainment.
Since 2018, robotic usage for domestic tasks has almost quadrupled, compared to a rise of almost half (+45.7%) for entertainment robots.
Robotics industry statistics #
According to the 2024 World Robotics Report by the IFR, the operational stock of industrial robots reached almost 4.3 million units in 2023. The annual installation figure of 541,000 for the year was the second-highest in recorded history and only 2% lower (553,000) than the record set in 2022.

In 2023, just over half (51%) of newly installed robots were located in China, with the automotive trade positioning itself as the largest customer of industrial robots for the year (roughly 25% of all new robots).
Industrial robotics market #
As of 2024, there were an estimated 4.37 million industrial robots in operation around the world, according to an analysis of robotics statistics by AIPRM.
Operational stock of industrial robots in factories around the world per year (2013-33) #
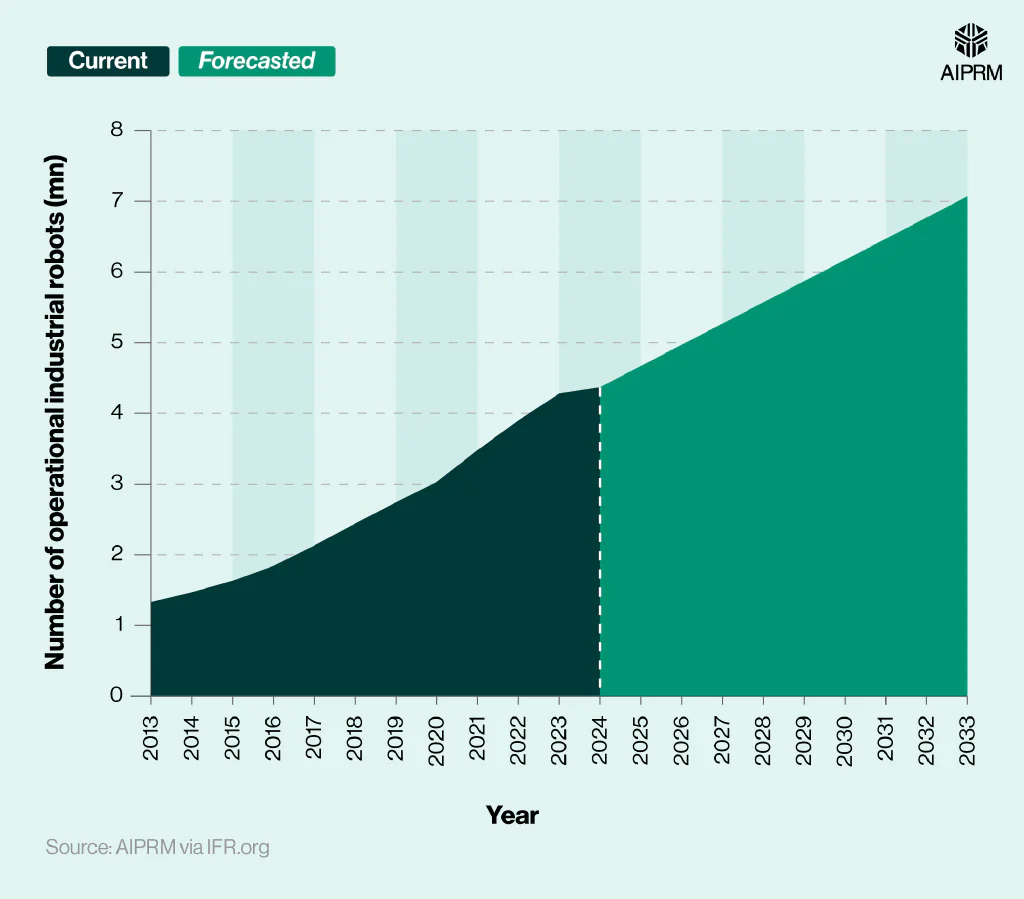
The industrial robotics market has gradually grown YoY since 2013, from 1.33 million to more than triple the amount in 2023 (4.28 million).
By 2033, the forecast is that the industrial robotics market size could exceed seven million units, around three-fifths (61.8%) more than in 2024.
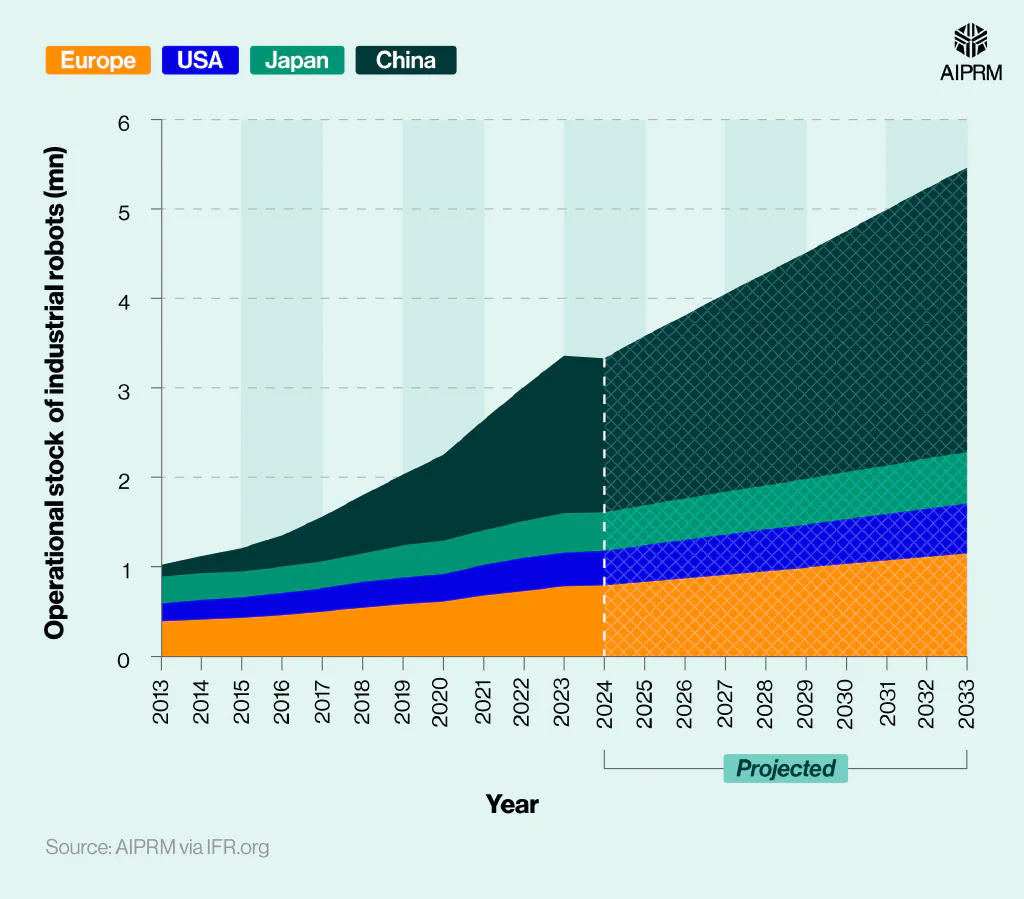
Operational stock (millions) of industrial robots in factories across selected regions/countries over time (2013-33) #
| Year | Europe | US | Japan | China |
|---|---|---|---|---|
| 2013 | 0.39 | 0.2 | 0.3 | 0.13 |
| 2014 | 0.41 | 0.22 | 0.3 | 0.19 |
| 2015 | 0.43 | 0.23 | 0.29 | 0.26 |
| 2016 | 0.46 | 0.25 | 0.29 | 0.35 |
| 2017 | 0.5 | 0.26 | 0.3 | 0.5 |
| 2018 | 0.54 | 0.29 | 0.32 | 0.65 |
| 2019 | 0.58 | 0.3 | 0.36 | 0.79 |
| 2020 | 0.61 | 0.31 | 0.37 | 0.96 |
| 2021 | 0.68 | 0.34 | 0.39 | 1.23 |
| 2022 | 0.73 | 0.37 | 0.41 | 1.5 |
| 2023 | 0.78 | 0.38 | 0.44 | 1.76 |
| 2024* | 0.79 | 0.39 | 0.43 | 1.72 |
| 2025* | 0.83 | 0.41 | 0.45 | 1.89 |
| 2026* | 0.87 | 0.43 | 0.46 | 2.05 |
| 2027* | 0.91 | 0.45 | 0.48 | 2.21 |
| 2028* | 0.95 | 0.47 | 0.49 | 2.37 |
| 2029* | 0.99 | 0.48 | 0.51 | 2.53 |
| 2030* | 1.03 | 0.5 | 0.53 | 2.69 |
| 2031* | 1.07 | 0.52 | 0.54 | 2.86 |
| 2032* | 1.11 | 0.54 | 0.56 | 3.02 |
| 2033* | 1.15 | 0.56 | 0.57 | 3.18 |
(Source: AIPRM via IFR.org)
*Projected figures
When separated by different regions, China had the largest proportion of industrial robots in 2024 at 1.72 million. This represented almost two-fifths (39.4%) of the total global industrial robot population for the year.
By 2033, this figure is predicted to almost double to 3.18 million. This growth is quite remarkable given that back in 2013, China had the fourth-largest industrial robot population in the world (0.13 million) – around three times less than that of Europe.
Around this time, Europe had approximately 0.39 million industrial robots in operation, a figure that is forecasted to almost triple by 2033 to 1.15 million.
In 2024, the US had around 0.39 million industrial robots (the same amount Europe had 11 years earlier). By 2033, the US industrial robot population is estimated to reach 0.56 million.
Number of industrial robots installed each year around the world (2018-27) #
| Year | Number of annual installations of industrial robots |
|---|---|
| 2018 | 423,000 |
| 2019 | 387,000 |
| 2020 | 390,000 |
| 2021 | 526,000 |
| 2022 | 553,000 |
| 2023 | 541,000 |
| 2024* | 541,000 |
| 2025* | 555,000 |
| 2026* | 575,000 |
| 2027* | 602,000 |
(Source: IFR.org)
*Projected figures
According to robotics statistics from the IFR, 541,000 industrial robots were installed in 2023 around the world, with 555,000 projected for 2025.
This figure has risen considerably since 2019, when around 387,000 new robots were brought into operation. By 2027, it’s expected that roughly 602,000 industrial robots will be installed throughout the year to keep up with the growing global demand for robotics in the workplace.
Global revenue ($bn) generated from industrial robotics over time (2019-29) #
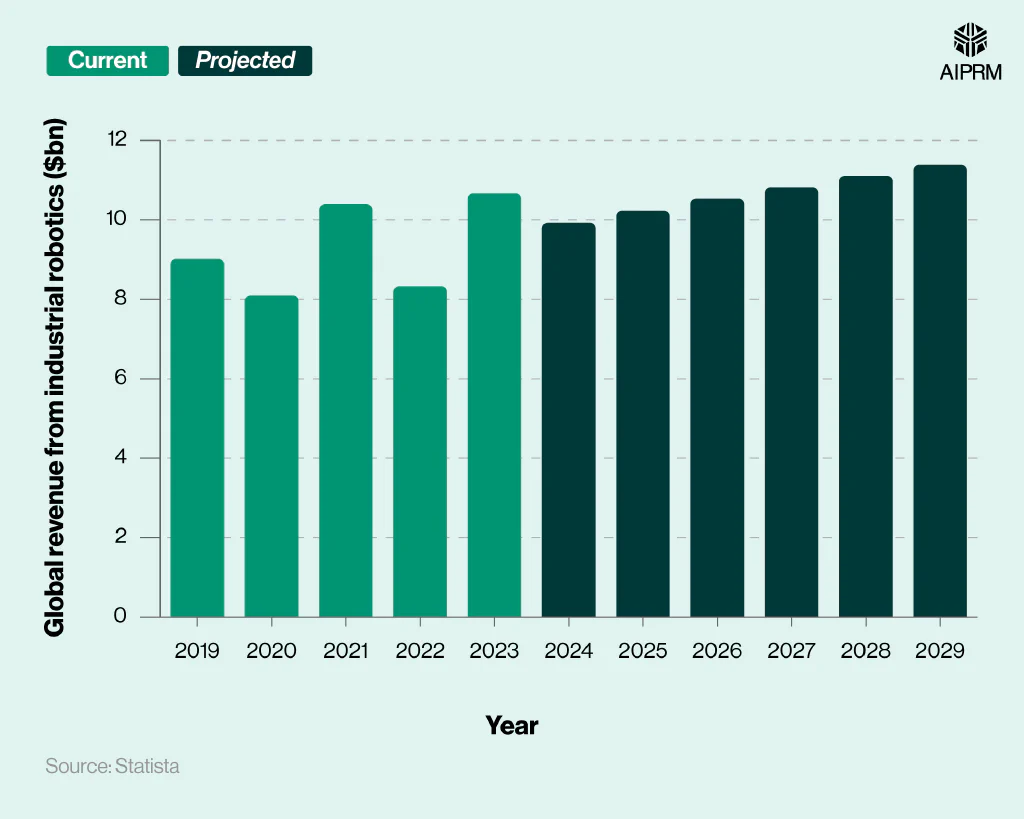
The global industrial robotics market size stood at approximately $9.92 billion in 2024, up 10% from 2019 but down 7% from the previous year.
By 2029, global revenue from industrial robotics is projected to reach $11.39 billion – a rise of more than a seventh (14.8%) from 2024.
Which industries have the most industrial robots installed worldwide? #
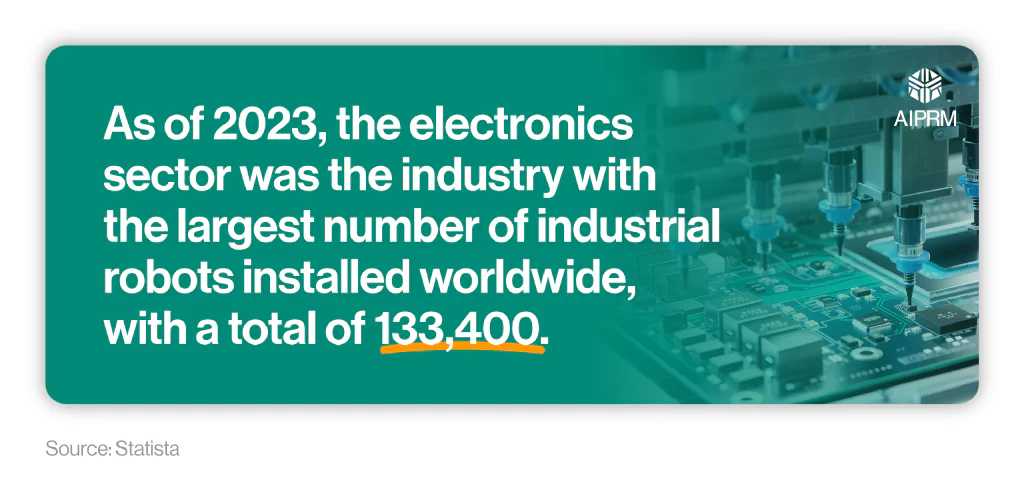
As of 2023, the electronics sector was the industry with the largest number of industrial robots installed worldwide, with a total of 133,400. This represents a drop of 21.6% from 2021, when the total stood at 170,100.
By 2029, electronics is still expected to lead in terms of the proportion of industrial robots across individual industries, although its total is expected to fall to 109,900. If correct, this will represent a decline of 17.6% between 2023 and 2029.
Over the same period, the number of industrial robots in the automotive sector is projected to rise by roughly 1.3%, from 83,150 in 2023 to 84,270 in 2029.
Percentage of global industrial robots by application (2024) #

Just over half (51.3%) of the global industrial robotics market used robots for handling tasks in 2024, making it the most popular application for robotics in the workplace for the year.
This was followed by around a seventh (14.67%) of industries that used robotics for welding and just over 10% that used them for assembling items.
Number of industrial robots installed each year in different regions of the world (2013-23) #
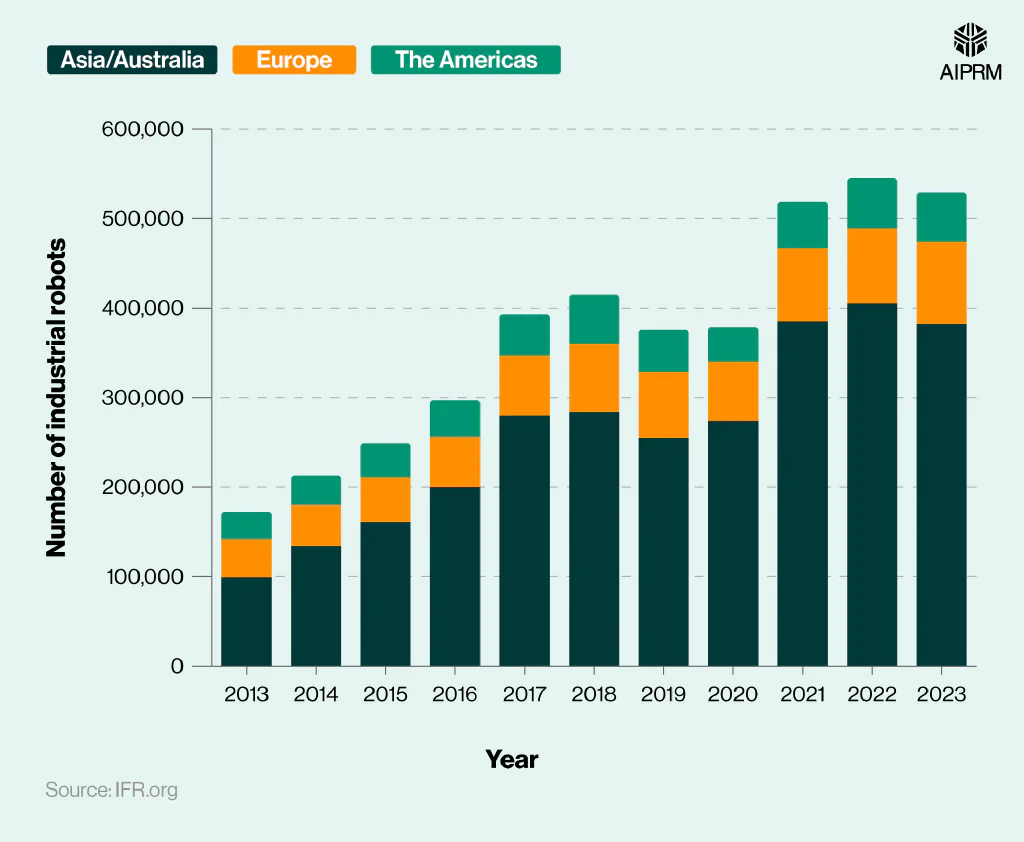
| Year | Asia/Australia | Europe | The Americas |
|---|---|---|---|
| 2013 | 99,000 | 43,000 | 30,000 |
| 2014 | 134,000 | 46,000 | 33,000 |
| 2015 | 161,000 | 50,000 | 38,000 |
| 2016 | 200,000 | 56,000 | 41,000 |
| 2017 | 280,000 | 67,000 | 46,000 |
| 2018 | 284,000 | 76,000 | 55,000 |
| 2019 | 255,000 | 74,000 | 47,000 |
| 2020 | 274,000 | 66,000 | 39,000 |
| 2021 | 385,000 | 82,000 | 52,000 |
| 2022 | 405,000 | 84,000 | 56,000 |
| 2023 | 382,000 | 92,000 | 55,000 |
(Source: IFR.org)
According to robotics data from the IFR, 382,000 industrial robots were installed across Asia and Australia in 2023 – nearly 6% less from 2022. This was over four times more than the whole of Europe and almost seven times more than the Americas for the same year, by comparison.
As of 2023, there were nearly four times more industrial robots in Asia and Australia compared to 10 years earlier. Yet, the industrial robotics markets of Europe and the Americas both saw the number of robots roughly double during this time.
Largest markets in the world for the installation of industrial robots (2023) #
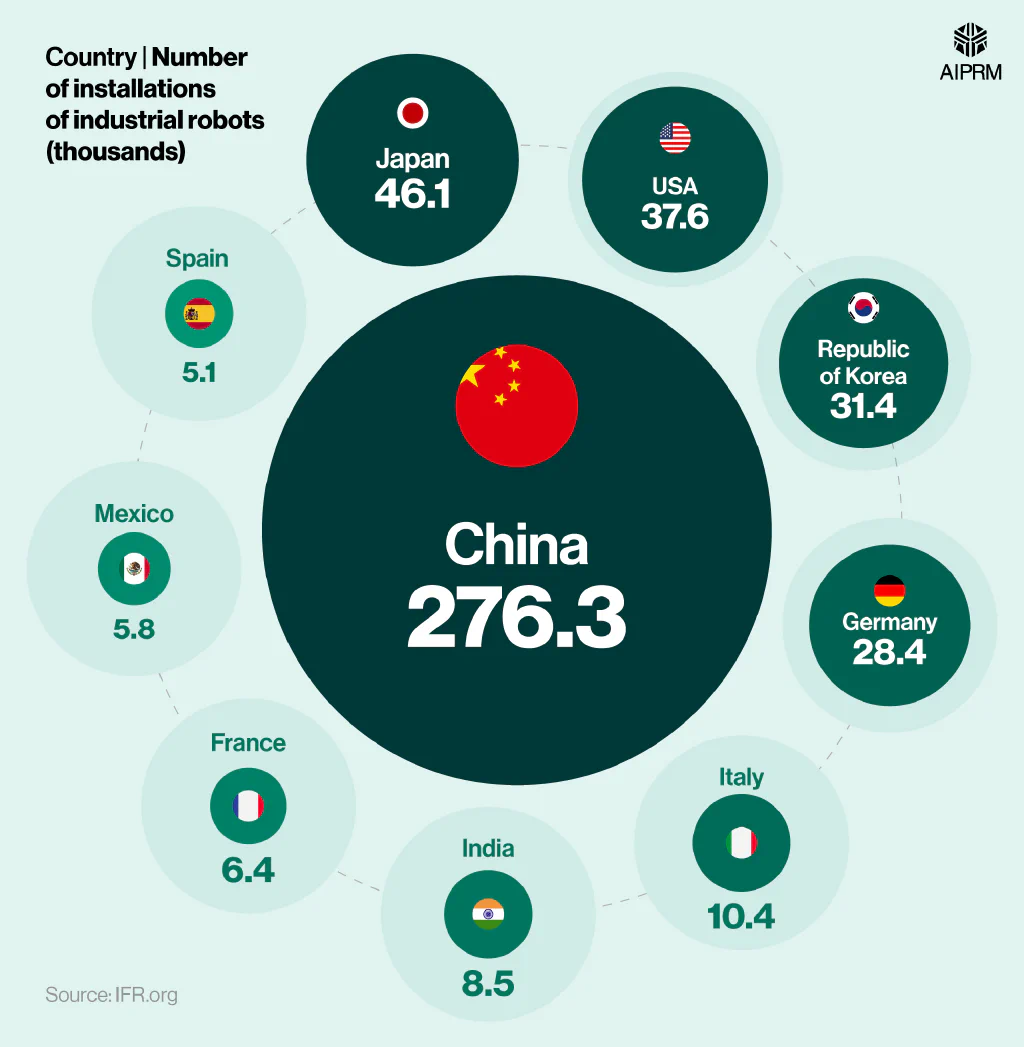
| Country | Number of installations of industrial robots (thousands) |
|---|---|
| China | 276.3 |
| Japan | 46.1 |
| United States | 37.6 |
| Republic of Korea | 31.4 |
| Germany | 28.4 |
| Italy | 10.4 |
| India | 8.5 |
| France | 6.4 |
| Mexico | 5.8 |
| Spain | 5.1 |
(Source: IFR.org)
China was responsible for the majority of industrial robots in 2023, at over 276,000. This was around six times more than neighboring Japan, which was in second place, with over 46,000.
The industrial robot population in the US stood at 37,600 as of 2023 – around a fifth (18%) less than Japan but a fifth (20%) more than the Republic of Korea.
Incidentally, of the five countries with the largest industrial robot populations in 2023, 60% were Asian nations, highlighting the region’s dominance in the global industrial robotics market.
Service robotics market #
The service robotics market is thought to be worth around $54.51 billion as of 2024.
Analysis of robotics statistics from Precedence Research suggests that this represents an increase of almost a sixth (15.3%) from the previous year.
Service robotics market size over time (2023-34) #
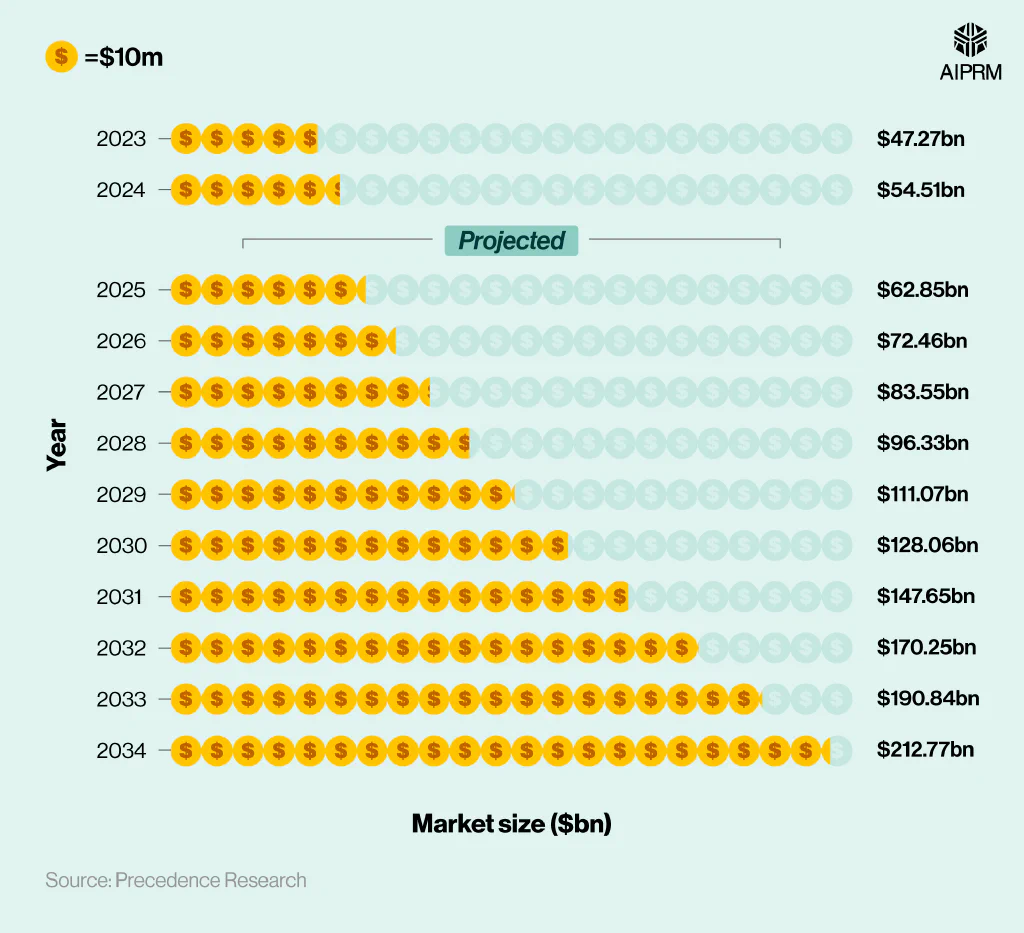
By 2034, the global service robotics market could reach a value of $212.77 billion – almost four times what it was worth in 2024 (a 290% increase in 10 years).
Global service robotics revenue ($bn) over time (2019-29) #
| Year | Commercial | Consumer |
|---|---|---|
| 2019 | $10.55 | $11.55 |
| 2020 | $11.34 | $12.06 |
| 2021 | $13.88 | $13.54 |
| 2022 | $15.33 | $13.70 |
| 2023 | $19.93 | $15.53 |
| 2024* | $20.58 | $15.62 |
| 2025* | $23.02 | $17.54 |
| 2026* | $25.49 | $20.12 |
| 2027* | $27.97 | $22.81 |
| 2028* | $30.44 | $25.83 |
| 2029* | $32.93 | $28.70 |
(Source: Statista)
*Projected figures
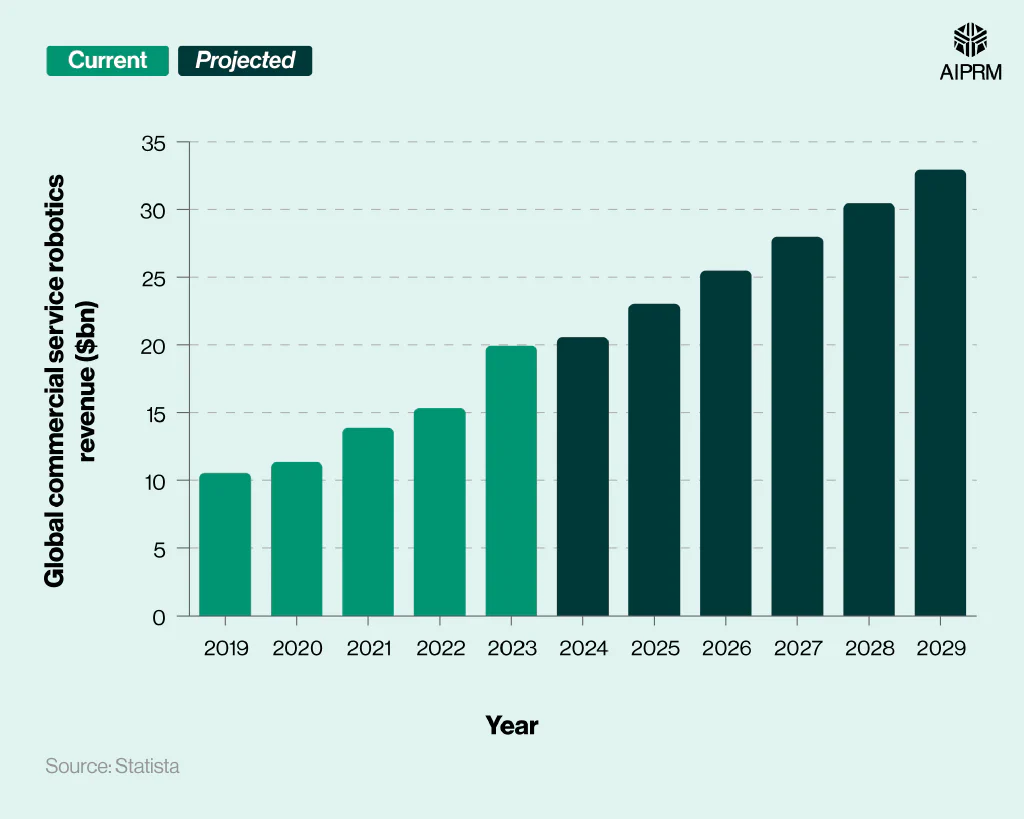
The commercial service robotics industry generated around $20.58 billion in 2024 – nearly $5 billion more than consumer service robotics.
Between 2019 and 2024, revenue from commercial robotics practically doubled compared to an increase of just over a third (35.2%) for consumer robotics.
Both are forecasted to rise in the coming years, with revenue from consumer robotics expected to increase the most by 2029 (83.7%) compared to around three-fifths (60%) for commercial service robotics.
Total global amount of service robots (millions) around the world each year (2019-29) #
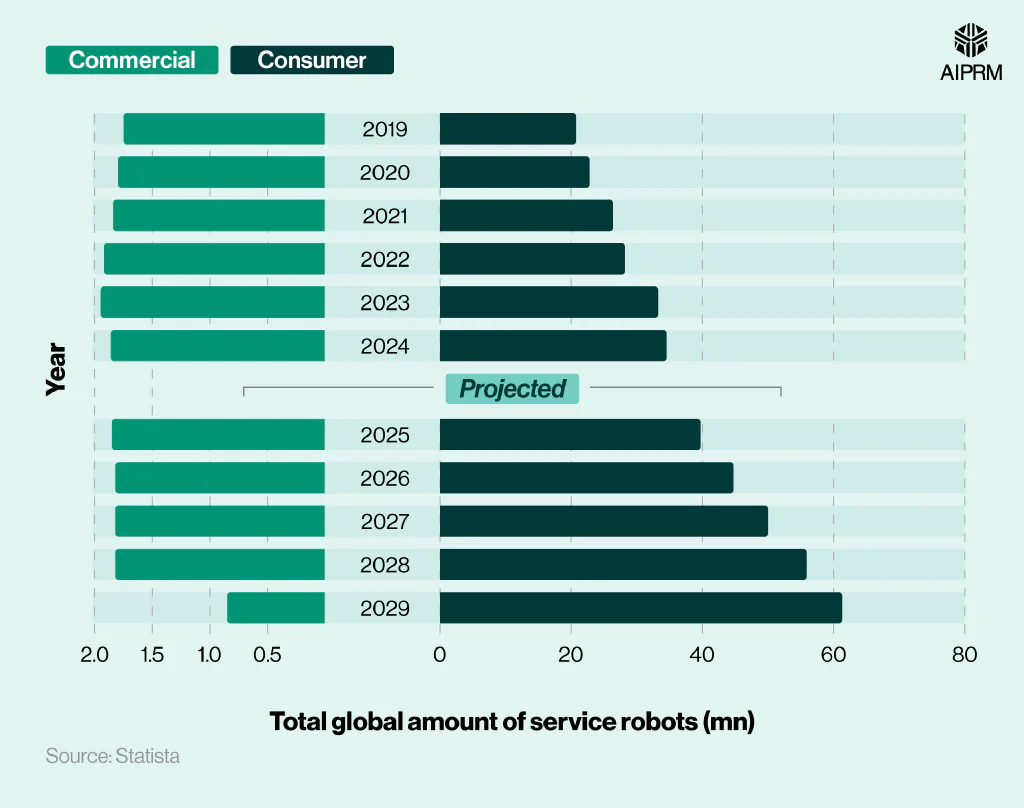
The service robotics market is dominated by consumer robotics. As of 2024, there were an estimated 36.43 million service robots in operation around the world, with almost 95% of these categorized as consumer robots.
By 2029, the number of consumer robots in circulation is expected to reach 61.32 million, more than three-quarters higher (77.4%) compared to 2024. Comparative figures for commercial service robots suggest there could be less than half (-54.3%) the number globally by 2029.
Average price per newly installed service robot over time (2019-29) #
| Year | Commercial | Consumer |
|---|---|---|
| 2019 | $23,140 | $520 |
| 2020 | $23,900 | $490 |
| 2021 | $29,920 | $470 |
| 2022 | $30,990 | $430 |
| 2023 | $32,430 | $420 |
| 2024* | $33,650 | $390 |
| 2025* | $34,480 | $380 |
| 2026* | $35,650 | $390 |
| 2027* | $36,460 | $390 |
| 2028* | $37,270 | $390 |
| 2029* | $38,900 | $400 |
(Source: Statista)
*Projected figures
In 2024, the average price of a newly installed service robot stood at $33,650 for commercial purposes and $390 for a typical consumer service robot.
Since 2019, the average cost of a commercial robot has gradually risen YoY, by almost half (45.4%) in the space of five years. Consumer service robotics experienced the opposite trend during this period, falling by a quarter (25%) between 2019 and 2024.
By 2029, the average price of a commercial service robot could reach $38,900 – almost 100 times more expensive than the typical consumer service robot in the same year ($400).
Service robotics market share by region (2023) #
| Region | Market share (%) |
|---|---|
| Asia Pacific | 36% |
| North America | 30% |
| Europe | 26% |
| Latin America | 4% |
| Middle East and Africa | 2% |
(Source: Precedence Research)
As of 2023, the Asia Pacific region had the largest global market share for service robotics at just over a third (36%). This was marginally ahead of North America (30%) and Europe, which occupied more than a quarter (26%) of the service robotics industry in 2023.
Most common applications for service robots #
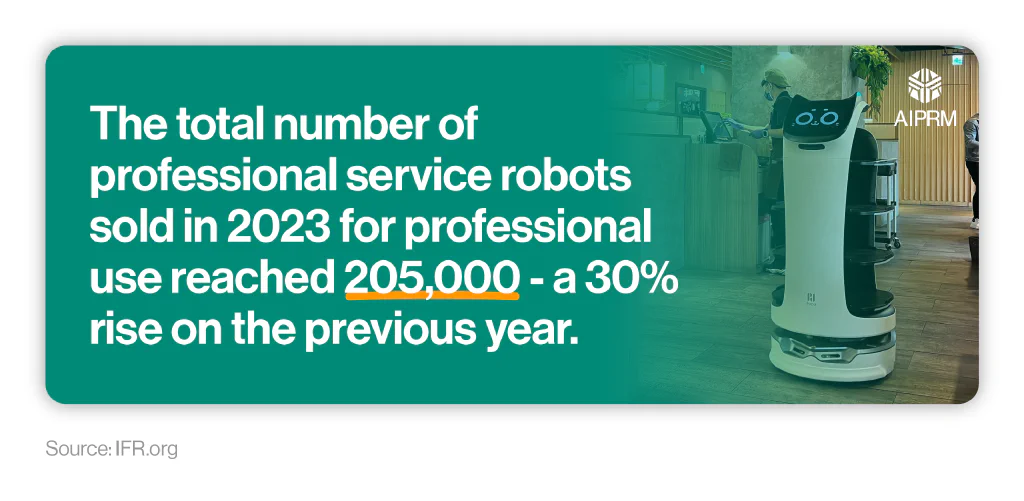
According to the IFR’s World Robotics Report 2024, the total number of service robots sold for professional use in 2023 reached 205,000 – an increase of 30% from the previous year.
The top five applications for service robots in 2023 were:
- Transportation and logistics
Sales grew by more than a third (35%) in 2023, with around 113,000 units sold. In 2022, sales of robots for open indoor environments with public traffic rose by more than three-quarters (78%) to 37,300, and many of these were adopted for food and beverage deliveries in restaurants.
- Hospitality
Approximately 54,000 robot units were sold in 2023 to the hospitality sector – up 31% from 12 months earlier. The most popular uses of this technology in hospitality are centered around mobile guidance, information, and telepresence.
- Agriculture
Robotic sales in agriculture grew by over a fifth (21%) in 2023 to almost 20,000 units. In 2022, more than 5,800 robots were sold for agricultural tasks such as milking and barn cleaning – a rise of 9% from the previous year.
- Professional cleaning
The professional cleaning robotic market grew by 4% in 2023, with the sale of around 12,000 robots. The main application in this area was floor cleaning, which accounted for around 70% of the overall market.
- Medicine
General sales of medical and healthcare robots grew more than a third (36%) in 2023 to around 6,100 units. The number of rehabilitation and non-invasive therapy robots sold rose by 128%, while demand for surgery robots increased by 14% and diagnostic robots climbed by 25%.
Sales of robots for consumer usage reached 4.1 million units in 2023 – around 20 times more than the professional market (205,000).
The largest consumer demand tends to be for domestic household robots, with almost 4.9 million sold in 2022.
Other notable trends in service robotics sales for 2022 included:
- Use of approximately 2.8 million indoor domestic floor cleaning robots, making them the most used application of service robots for the year.
- More than 1.1 million gardening robots.
- Around 157,000 units for social interaction and education purposes (53,000 vs. 104,000, respectively).
Commercial robotics market #
As of 2024, global revenue for the commercial service robotics market is projected to reach $20.58 billion. If correct, this will represent a year-on-year increase of 3.3% and mean that industry revenue nearly doubled (+95.1%) between 2019 and 2024.
Global commercial service robotics revenue ($bn) over time by industry (2019-29) #
By 2029, it’s predicted that the global commercial robotics market could generate $32.93 billion, a rise of three-fifths (60%) from the projected 2024 figures. If correct, then global revenue for commercial robotics will more than triple between 2019 and 2029.
Warehouse robotics market #
The logistics industry is the backbone of international trade and represents around 10% of global GDP. Companies have already invested heavily in robotics and automation, with sales of professional service robots for the transportation of goods or cargo growing by more than two-fifths (44%) between 2021 and 2022.
Labor shortages are threatening to affect future growth within the logistics industry, which is where a new generation of AI-powered robots can help tackle this challenge.
The International Road Transport Union (IRU) claims there are over three million driver positions to be filled worldwide. Due to a demographic gap between young and old drivers, global driver shortages are predicted to double by 2028.
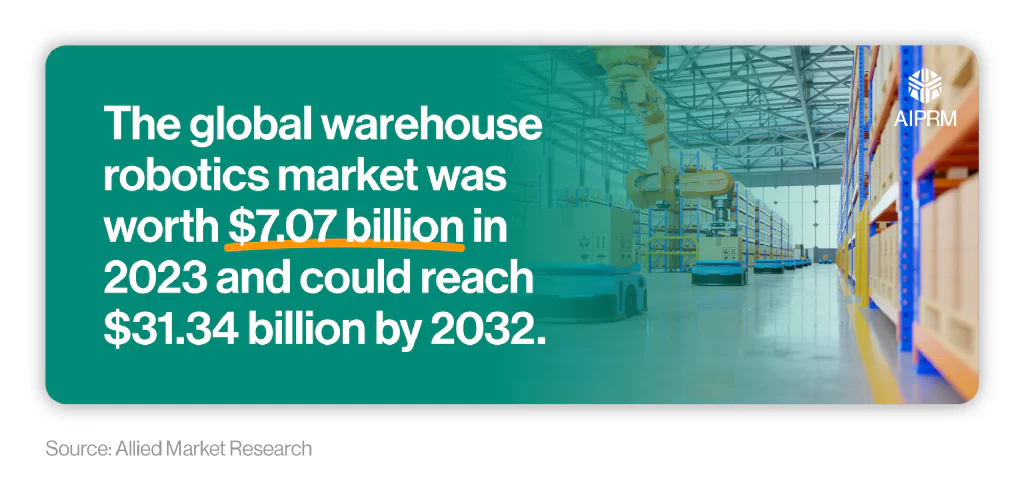
The global warehouse robotics market was valued at $7.07 billion in 2023. It’s predicted to reach $31.34 billion by 2032, growing at a CAGR of almost a fifth (18.2%) between 2024 and 2032.
In total, 12,305 robotic units were sold in Q1 2024, a quarter (25%) increase from the same period the previous year.
Companies are even investing in creating bespoke robotic solutions, with Amazon announcing plans to spend $1 billion on improving their warehouse automation processes and Walmart claiming a staggering $14 billion worth of investment in the coming years.
Artificial intelligence and robotics in the aerospace and defense market #
The aerospace robotics market was valued at $2.7 billion in 2023. North America has the largest market share, occupying over a third (35%) of the global aerospace robotics industry in 2023.
With an estimated CAGR of more than 13% between 2024 and 2032, the global aerospace robotics market could exceed $8 billion by 2032. By this stage, the hardware segment is predicted to constitute the largest proportion at more than $3.5 billion.
Industrial robotization is proving to be a global technological megatrend across multiple industries. The global supply of aerospace robotics practically doubled between 2012 and 2016, from 159,000 to 294,000.
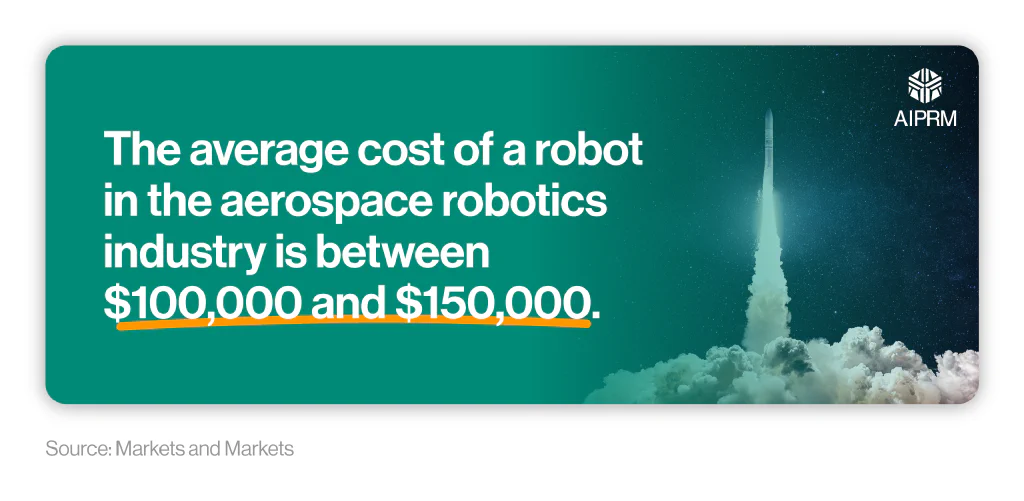
However, this doesn’t come cheap, with the average cost of a robot in the aerospace robotics market being between $100,000 and $150,000 per installation.
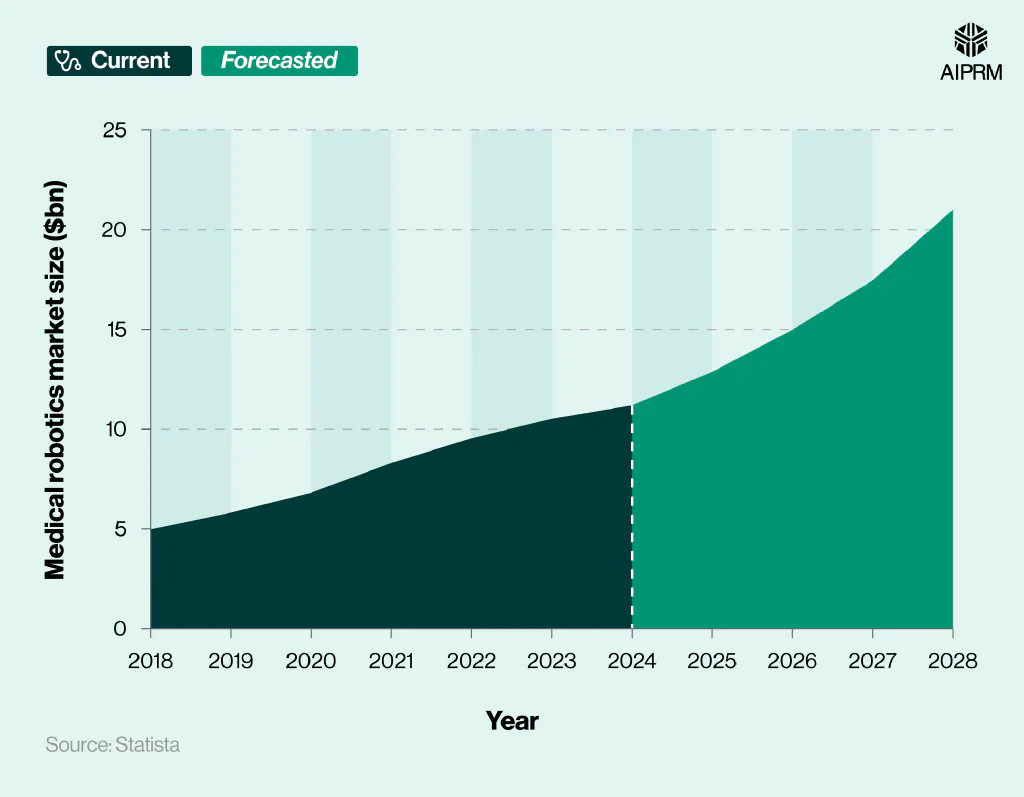
Medical robotics market #
The medical robotics market was worth an estimated $11.19 billion in 2024, more than double (+125%) its value in 2018 ($4.97 billion).
Since 2018, the global medical robotics market has grown YoY. By 2028, it’s expected to reach a value of $20.99 billion – around 87.6% more than in 2024.
Global medical robotics market size over time (2018-28) #
In terms of revenue, analysis by Markets and Markets suggests the global medical robotics market could be worth $16 billion as of 2024. With an estimated CAGR of 16.1% between 2024 and 2029, this could reach a total of $33.8 billion by 2029.
Food robotics market #
The food robotics market was valued at $3.2 billion in 2022. With an estimated CAGR of more than 12% between 2023 and 2032, this could result in a market value of more than $10.5 billion by 2032.
North America held the largest share of the global food robotics market in 2022 at around a third (32%), with the robots segment occupying around 70% of the overall industry.
Space robotics market #
According to the latest robotics statistics from Precedence Research, the global space robotics market was reportedly worth $5.25 billion in 2024.
Global space robotics market size (2024-34) #
| Year | Value ($bn) |
|---|---|
| 2024 | $5.25 |
| 2025* | $5.71 |
| 2026* | $6.21 |
| 2027* | $6.76 |
| 2028* | $7.36 |
| 2029* | $8.01 |
| 2030* | $8.72 |
| 2031* | $9.48 |
| 2032* | $10.32 |
| 2033* | $11.23 |
| 2034* | $12.09 |
(Source: Precedence Research)
*Projected figures
This figure is expected to more than double by 2034 to a value of $12.09 billion.
US space robotics market size over time (2024-34) #
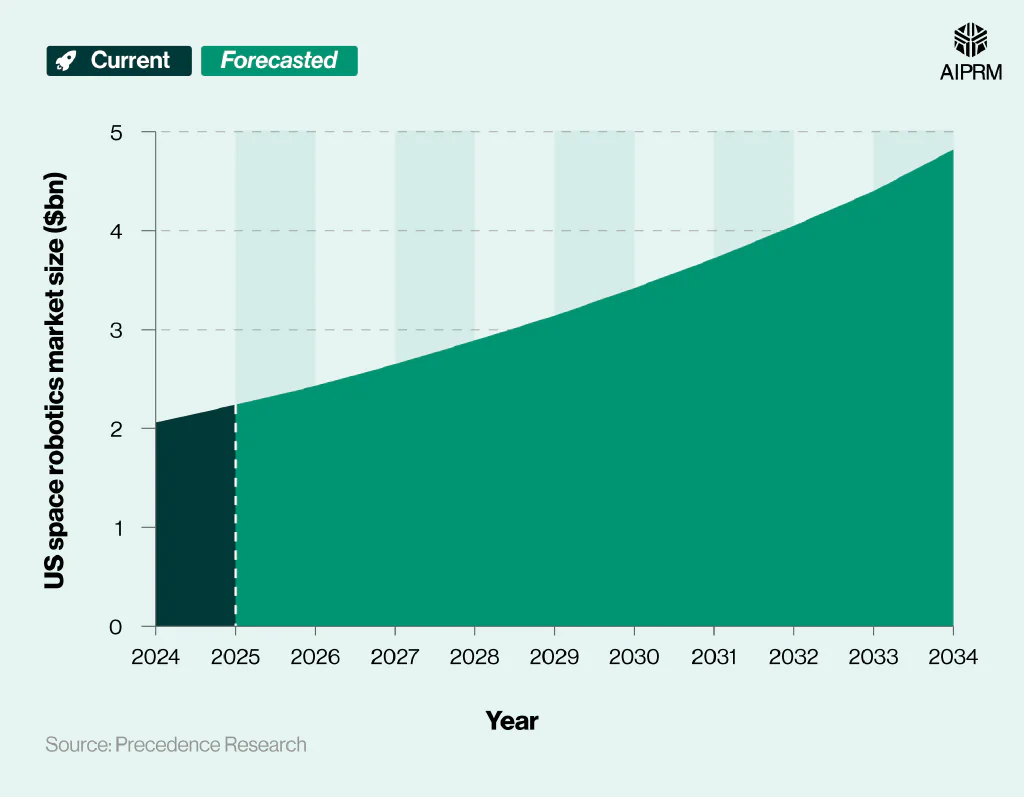
The US space robotics market was worth around $2.06 billion as of 2024. Positive growth is forecasted in the coming years, which could see the US space robotics market valued at $4.82 billion by the end of 2034 – more than double its worth in 2024.
Global space robotics market share by region (2024) #
| Region | Market share (%) |
|---|---|
| North America | 56% |
| Europe | 22% |
| Asia Pacific | 18% |
| Latin America, Middle East, and Africa (LAMEA) | 4% |
(Source: Precedence Research)
North America was responsible for more than half (56%) of the global space robotics market in 2024, followed by Europe with a market share of just over a fifth (22%), and Asia with 18%.
Automotive robotics market #
The automotive industry has one of the largest numbers of robots working in factories around the world, with an operational stock of around one million units as of 2023. This represents about a third of the total number installed across all industries across the globe.
When considering robot density in the automotive sector, the Republic of Korea leads with 2,867 industrial robots per 10,000 employees as of 2021. This was followed by Germany (1,500), the US (1,457), and Japan (1,422).
Ambitious political targets surrounding the production of electric vehicles are forcing countries to invest in new technologies.
For example:
- The European Union (EU) has announced plans to end the sale of air-polluting vehicles by 2035.
- The US government aims to reach a 50% market share for electric vehicle sales by 2030.
- All new vehicles sold in China must be powered by “new energy” by 2035.
Global revenue ($bn) from the automotive robotics market over time (2019-29) #
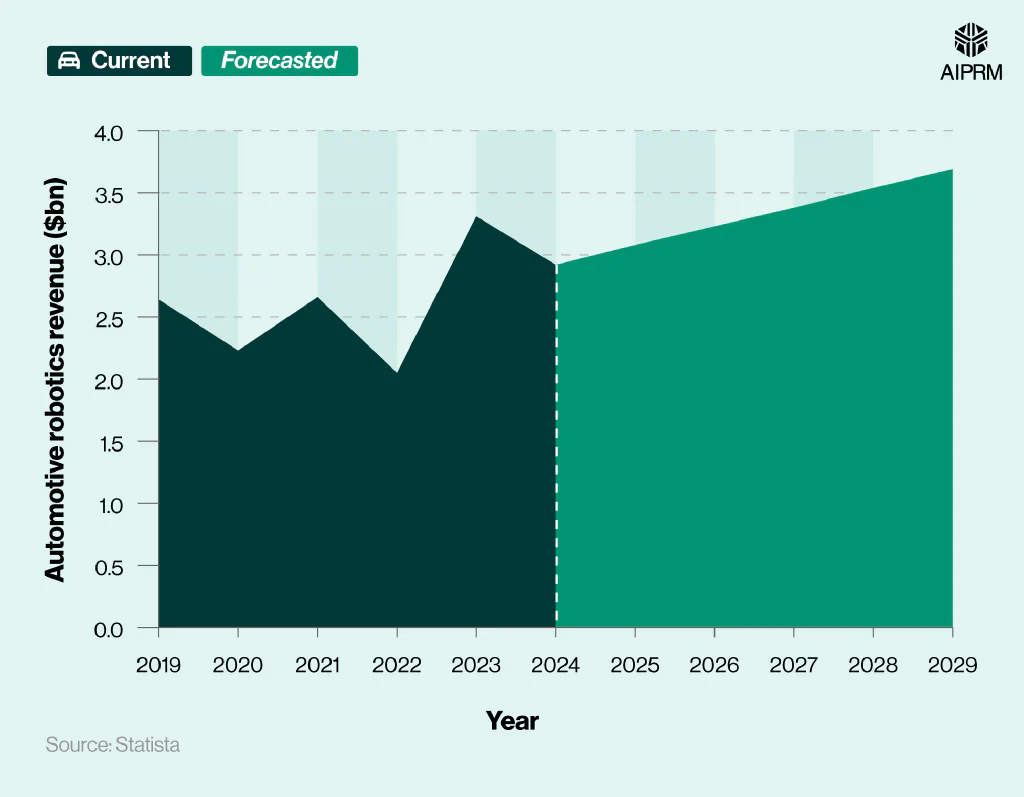
The global automotive robotics market generated around $2.92 billion in 2024, a fall of 11.8% from the previous year.
By 2029, revenue from automotive robots is predicted to rise to $3.69 billion (an increase of more than a quarter (26.4%) in the space of five years).
Average price per newly installed automotive industry robot over time (2019-29) #
| Year | Average price ($) |
|---|---|
| 2019 | $23,480 |
| 2020 | $21,790 |
| 2021 | $21,480 |
| 2022 | $20,090 |
| 2023 | $21,610 |
| 2024* | $22,290 |
| 2025* | $22,830 |
| 2026* | $23,720 |
| 2027* | $24,220 |
| 2028* | $24,710 |
| 2029* | $25,210 |
(Source: Statista)
*Projected figures
The average price of a newly installed automotive industry robot stood at $22,290 in 2024. This figure has fluctuated since 2019 but is expected to rise in the later part of the decade up to $25,210 by 2029 – an increase of 13.1% in the space of five years.
Underwater robotics market #
The global underwater robotics market was valued at $1.54 billion in 2024. Revenue from the sale of underwater robots is forecasted to increase by 13.7% between 2024 and 2034, resulting in a potential market value of $5.57 billion by 2034.
East Asia is expected to lead the way, accounting for almost a quarter (23.7%) of the global underwater robotics market by 2034. Almost two-fifths (38.9%) of revenue from the industry is predicted to come from the commercial segment, making it the largest contributor.
Consumer robotics market #
As of 2024, the consumer robotics market is expected to reach a value of $15.62 billion, with the majority of this attributed to the sale of domestic service robots.
Global consumer service robotics revenue ($bn) over time (2019-29) #
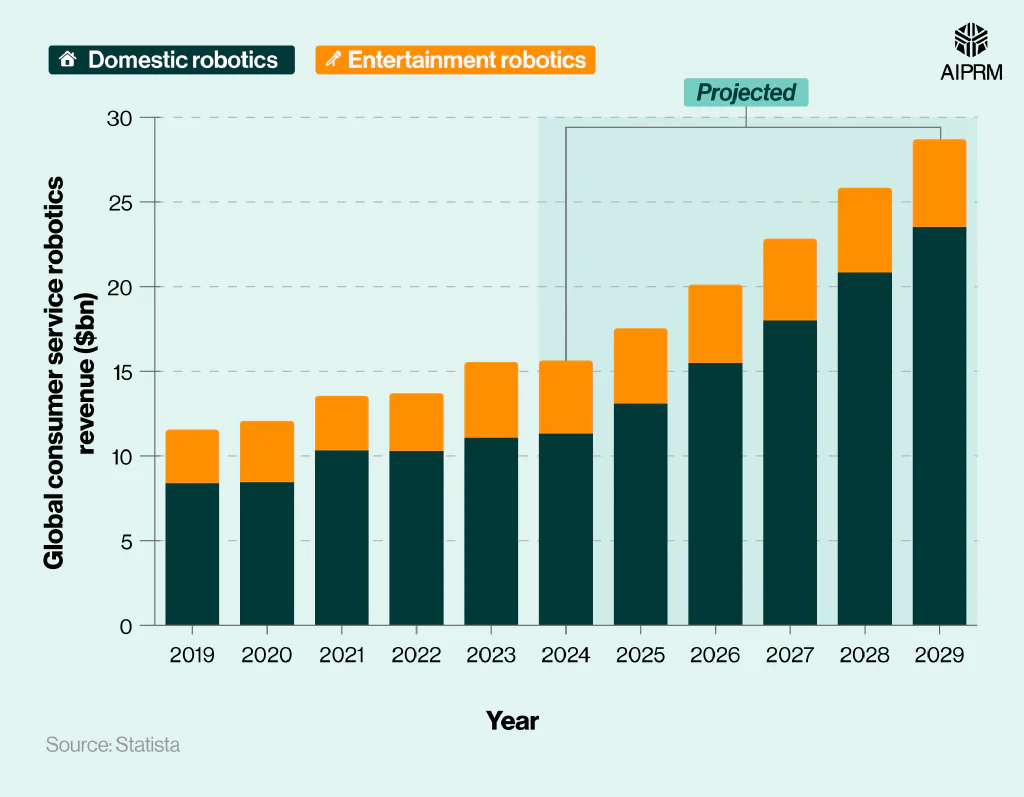
Revenue from consumer service robotics is forecasted to rise between 2024 and 2029 by more than four-fifths (83.7%), reaching $28.7 billion.
Total global number of consumer service robots over time (2019-29) #
In 2024, the global consumer robotics market consisted of approximately 34.58 million robots. More than two-thirds (68.9%) of these were located in a domestic setting.
The number of consumer robots in operation has risen YoY since 2019, and this growth is forecasted for both domestic and entertainment robots going forward.
By 2029, the consumer robotic market size is expected to reach 61.32 million – an increase of more than three-quarters (77.3%) from 2024. By this point, more than four in five (81.1%) service robots may be for domestic purposes.
Average price per newly installed consumer service robot over time (2019-29) #
| Year | Domestic service robotics | Entertainment service robotics |
|---|---|---|
| 2019 | $640 | $400 |
| 2020 | $610 | $370 |
| 2021 | $580 | $350 |
| 2022 | $550 | $310 |
| 2023 | $530 | $300 |
| 2024* | $510 | $270 |
| 2025* | $500 | $270 |
| 2026* | $500 | $270 |
| 2027* | $500 | $270 |
| 2028* | $510 | $280 |
| 2029* | $510 | $280 |
(Source: Statista)
*Projected figures
The average price of a newly installed domestic service robot in 2024 was $510 – around 89% more than a typical entertainment service robot.
Between 2019 and 2029, the average cost of service robots in the consumer industries is generally expected to decrease by around a fifth (20.3%) in the domestic sector and almost a third (30%) in the entertainment industry.
Household cleaning robotics market #
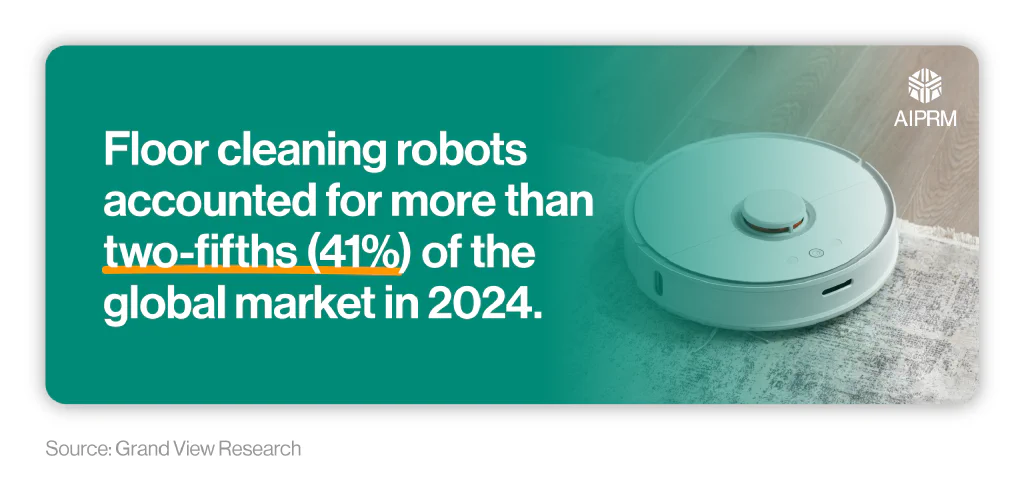
The global household cleaning robotics market was reported to be worth $5.98 billion in 2024, with an estimated CAGR of 23.7% between 2025 and 2030.
Floor cleaning robots accounted for more than two-fifths (41%) of the global market in 2024, making it the largest market revenue share across all types of household cleaning robots.
On a wider scale, the global cleaning robot market was thought to be worth around $12.2 billion in 2024. With a CAGR of more than a fifth (21.7%) between 2024 and 2034, the global cleaning robotic market is expected to be worth a staggering $87 billion by 2034.
Robotics FAQs #
What is robotics?
Robotics is a branch of engineering and computer science that involves the design, manufacturing, and operation of robots.
Why is robotics important?
Robotics is important for several reasons. They can be used to increase productivity in the workplace by performing repetitive tasks more efficiently, precisely, and quickly than humans. Robots can also be used to increase safety by performing dangerous tasks, improving a company’s environmental impact, and problem solving to boost efficiency in the workplace.
What effect has robotics had on manufacturing?
Robotics has had many positive impacts on the manufacturing industry. It has helped improve accuracy and consistency with production while helping companies offer a better quality product for the consumer. The added efficiency of this has also helped reduce waste, increase yield, and boost flexibility when it comes to manufacturing processes.
However, there have been some challenges faced with the introduction of robotics in the manufacturing sector. The initial investment cost is high, and ongoing maintenance costs must be considered. Some are also worried about potential job losses if robots continue to perform tasks better and more efficiently than humans.
What are some of the careers that use robotics?
Many careers use robotics, including robotics engineers, computer scientists, software engineers, design engineers, robotics machine operators, robot programmers, and electrical maintenance engineers (to name but a few).
What does a robotics engineer do?
A robotics engineer is responsible for several tasks, including designing, building, and maintaining machines that perform tasks in place of humans (i.e., robots). They are also required to test, analyze, and report back on their performance, as well as research alternative options for a more efficient outcome.
How to become a robotics engineer
To become a robotics engineer, you’ll need a relevant bachelor’s degree and to learn programming, including proficiency in writing code. You should also have a knowledge and understanding of systems integration, as well as develop skills in design, complex problem-solving, and verbal communication.
What degree do you need to be a robotics engineer?
To be a robotics engineer, you’ll need a degree in a relevant field, such as computer science, computer engineering, mechanical engineering, electrical engineering, or mechatronics.
What is robotics engineering?
Robotics engineering is a multidisciplinary field involving the design, building, operation, and maintenance of robots and robotic systems. It’s a combination of electrical, mechanical, and computer engineering and focuses on the practical application of robots.
What is robotics process automation?
Robotic Process Automation (RPA) uses technology to perform repetitive tasks normally conducted by human workers. Also known as software robotics, RPA combines an Application Programming Interface (API) and User Interface (UI) to emulate these tasks for improved efficiency, accuracy, and precision.
What does autonomous mean in robotics?
In robotics, the term ‘autonomous’ refers to a task undertaken by a robot that can be performed by itself without human intervention. Autonomous robots often have sophisticated features that enable them to understand their physical environment and conduct tasks that traditionally might have been done by humans.
What is soft robotics?
Soft robotics involves the use of robots that are flexible, compliant, and malleable. They are designed using soft materials (as opposed to traditional robots made from hard materials like metal and plastic) to mirror biological systems and organisms.
What is an actuator in robotics?
In robotics, an actuator is a device that enables something to happen, such as a robotic movement using motors. It essentially converts energy into a physical motion (e.g., activating a claw grip to pick up an item).
Robotics glossary #
Commercial robotics #
The use of electronic devices (i.e., robots) to automate tasks considered to be repetitive, dangerous, and/or difficult for humans to complete. They can be used across a variety of industries, including:
- Retail (to help with customer service, cleaning, and inventory management).
- Agriculture (to assist with harvesting, weed control, and spraying).
- Mining (to monitor environmental conditions and gather real-time data to ensure worker safety).
Consumer robotics #
The use of robotic technology for individuals as opposed to industrial or professional use. These are designed to be small, portable, and easy to use for a variety of tasks, including:
- Housekeeping
- Entertainment
- Education
- Personal care
Industrial robotics #
The use of automated machinery to perform tasks within an industrial environment, such as manufacturing and warehouses. They are often used to perform tasks deemed repetitive/dangerous that require a high level of precision and versatility.
Robot density #
A measure for the degree of automation within an organization/country/region/sector, expressed as the average number of robots per a given number of employees (usually 10,000).
Robotic engineer #
Someone employed to design, build, and maintain robots and robotic systems within an organization.
Robotics #
A branch of engineering and computer science that involves the design, creation, manufacturing, and operation of robots and robotic systems.
Service robotics #
The use of machines and robotic technology to assist human workers with a variety of tasks that may be deemed too repetitive, hazardous, and/or time-consuming. They tend to work on their own or with minimal intervention from humans.
For more definitions, check out AIPRM’s ultimate generative AI glossary.
Sources #
https://ifr.org/ifr-press-releases/news/presidents-report-by-marina-bill-3-2024
https://www.precedenceresearch.com/robotics-technology-market
https://www.statista.com/outlook/tmo/robotics/worldwide
https://ifr.org/ifr-press-releases/news/robot-sales-in-north-american-manufacturing-up-12-percent
https://www.iotworldtoday.com/robotics/robot-installations-top-500-000-a-year-china-dominates
https://ifr.org/downloads/press2018/2024-SEP-24_IFR_press_release_World_Robotics_2024_-_Japan.pdf
https://ifr.org/downloads/press2018/2024-SEP-24_IFR_press_release_World_Robotics_2024_-_India.pdf
https://ifr.org/downloads/press2018/2024-SEP-24_IFR_press_release_World_Robotics_2024_-_Europe.pdf
https://ifr.org/ifr-press-releases/news/u.s-companies-invest-heavily-in-robots
https://www.statista.com/outlook/tmo/robotics/industrial-robotics/asia
https://ifr.org/ifr-press-releases/news/chinas-new-growth-strategy-backed-by-robots
https://ifr.org/ifr-press-releases/news/robots-help-to-solve-japans-2024-problem
https://ifr.org/ifr-press-releases/news/indias-robot-boom-hits-all-time-high
https://ifr.org/ifr-press-releases/news/eu-industries-invest-heavily-in-robotics
https://www.statista.com/outlook/tmo/robotics/industrial-robotics/europe
https://www.grandviewresearch.com/horizon/outlook/industrial-robotics-market/mea
https://www.businessmarketinsights.com/reports/middle-east-and-africa-industrial-robotics-market
https://www.statista.com/outlook/tmo/robotics/south-america
https://www.statista.com/chart/13645/the-countries-with-the-highest-density-of-robot-workers/
https://ifr.org/ifr-press-releases/news/global-robotics-race-korea-singapore-and-germany-in-the-lead
https://ifr.org/img/worldrobotics/Press_Conference_2024.pdf
https://www.statista.com/chart/32239/global-market-share-of-industrial-robotics-companies/
https://www.recruiter.com/careers/robotics-engineers/outlook/
https://www.kaggle.com/datasets/arshkon/linkedin-job-postings?select=postings.csv
https://www.coolest-gadgets.com/robots-statistics
https://www.mordorintelligence.com/industry-reports/robotics-market
https://ifr.org/ifr-press-releases/news/record-of-4-million-robots-working-in-factories-worldwide
https://ifr.org/ifr-press-releases/news/sales-of-service-robots-up-30-worldwide
https://www.statista.com/outlook/tmo/robotics/industrial-robotics/worldwide
https://www.precedenceresearch.com/service-robotics-market
https://www.statista.com/outlook/tmo/robotics/service-robotics/worldwide
https://ifr.org/ifr-press-releases/news/staff-shortage-boosts-service-robots-sales-up-48
https://ifr.org/post/a-new-way-forward
https://ifr.org/post/up-skilling-today-and-tomorrows-workforce-for-automation
https://www.statista.com/outlook/tmo/robotics/service-robotics/commercial-service-robotics/worldwide
https://www.alliedmarketresearch.com/warehouse-robotics-market
https://www.gminsights.com/industry-analysis/aerospace-robotics-market
https://www.marketsandmarkets.com/Market-Reports/aerospace-robotic-market-164758944.html
https://www.statista.com/forecasts/1321270/worldwide-medical-robotics-market-size
https://www.marketsandmarkets.com/Market-Reports/medical-robotic-systems-market-2916860.html
https://www.factmr.com/report/radiosurgery-and-radiotherapy-robots-market
https://www.gminsights.com/industry-analysis/food-robotics-market
https://www.precedenceresearch.com/space-robotics-market
https://ifr.org/ifr-press-releases/news/one-million-robots-work-in-car-industry-worldwide-new-record
https://www.factmr.com/report/underwater-robots-market
https://www.marketresearchfuture.com/reports/underwater-robotics-market-7605
https://www.statista.com/outlook/tmo/robotics/service-robotics/consumer-service-robotics/worldwide
https://www.grandviewresearch.com/industry-analysis/cleaning-robot-market
https://www.futuremarketinsights.com/reports/cleaning-robot-market
https://www.techtarget.com/whatis/definition/robotics
https://business.esa.int/funding/invitation-to-tender/robotics-for-society
https://www.goodwin.edu/enews/impact-of-robotics-in-manufacturing/
https://funtech.co.uk/latest/what-careers-use-robotics-in-their-daily-work
https://www.indeed.com/career-advice/finding-a-job/careers-in-robotics
https://nationalcareers.service.gov.uk/job-profiles/robotics-engineer
https://uk.indeed.com/career-advice/finding-a-job/what-does-robotics-engineer-do
https://www.forbes.com/advisor/education/engineering/how-to-become-a-robotics-engineer
https://www.mtu.edu/ece/undergraduate/robotics/what-is/
https://www.ibm.com/topics/rpa
https://www.techopedia.com/definition/32694/autonomous-robot
https://www.bristolroboticslab.com/soft-robotics
https://www.futurelearn.com/info/courses/begin-robotics/0/steps/2860
https://retailminded.com/what-are-commercial-robots/
https://www.complexica.com/narrow-ai-glossary/consumer-robotics
https://www.telefonica.com/en/communication-room/blog/industrial-robots-what-how-work-types/
https://ifr.org/wr-industrial-robots/
Methodologies #
Forecasting future trends in the robotics industry #
https://ifr.org/ifr-press-releases/news/record-of-4-million-robots-working-in-factories-worldwide
https://www.recruiter.com/careers/robotics-engineers/outlook/
Analysis of job adverts in the US for robotic engineers #
https://www.kaggle.com/datasets/arshkon/linkedin-job-postings?select=postings.csv