100+ Women in Tech Statistics 2025

Technology is now vital to the way we live, work, and structure society. Yet, estimates suggest a significant gender gap in the tech industry in terms of employment, with less than a third (29%) of roles in the digital sector held by women.
With this in mind, AIPRM has compiled the latest women in tech statistics for 2024-25, highlighting various tech industry demographics across the US and globally, as well as the latest diversity in tech statistics, including gender.
We explore gender inequality in technology employment, including the gender pay gap in tech and the future of females working in this industry.
Top 10 must-know women in tech statistics for 2025 #
- The proportion of women working in tech in 1984 was around 35% compared to an estimated 32% in 2023.
- There were around 19% fewer women working in tech in the US than males in 2023, with this figure falling to 18% in 2024.
- Of the Fortune 500 Global List of Tech Companies, just three have a female CEO.
- Luxembourg had the largest percentage of female workers employed in tech across Europe in 2024 (74.5% of the active female working population), compared with Romania (40.2%), which had the lowest proportion.
- Around 14% of global tech leaders were female in 2023 – up from 8% in 2015.
- Maryland is the best US state for women in tech, according to an AIPRM study.
- Just under half (46%) of US data scientists and analysts are women – the highest percentage share across all tech job titles.
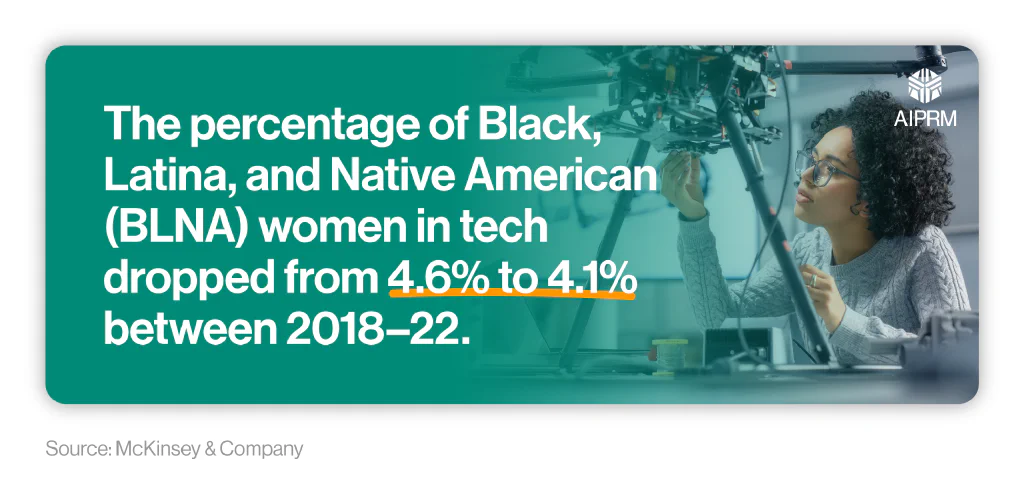
- The percentage of Black, Latina, and Native American (BLNA) women in tech dropped from 4.6% to 4.1% between 2018 and 2022.
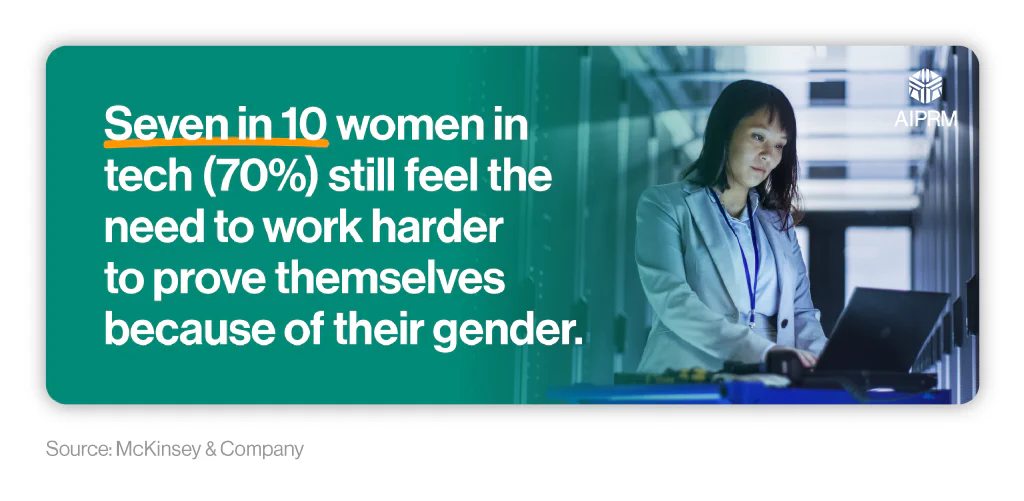
- Seven in 10 (70%) women in tech still feel they need to work harder to prove themselves because of their gender.
- Less than one in 10 people (8%) believe the gender gap in tech will never be closed.
How many women are in tech? #
According to the latest Nash Squared Digital Leadership Report, around 14% of global tech leaders in 2023 were women – the same percentage as in 2022.
The percentage of female tech leaders over time #
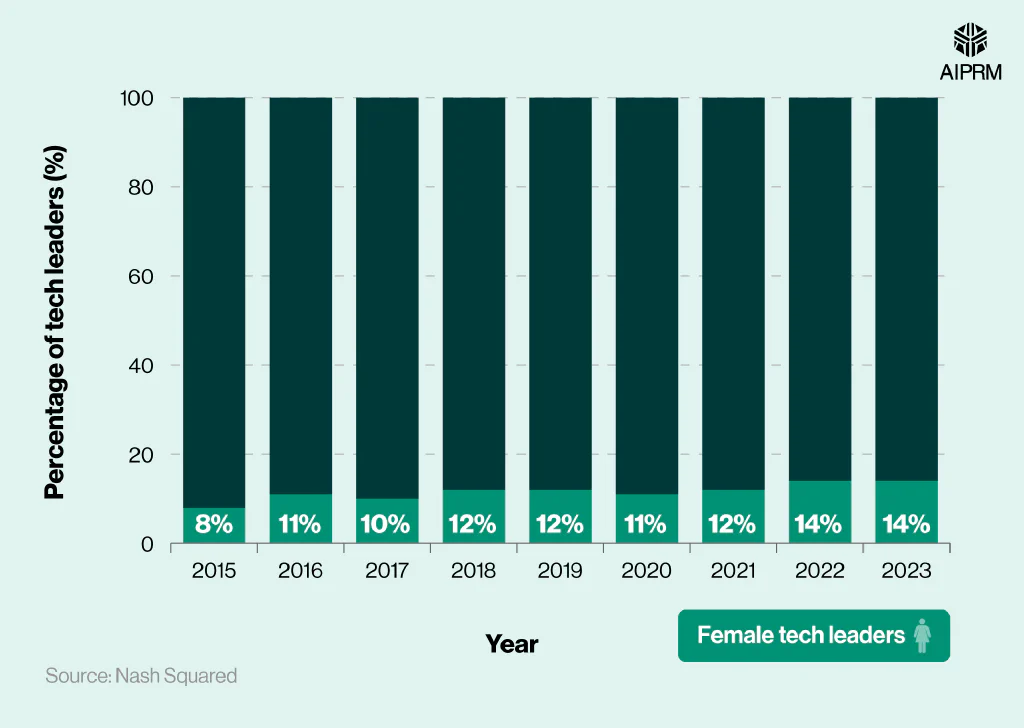
This represents a six percentage point rise from 2015, when just 8% of global tech leaders were women.
The global average percentage of women on a company’s tech team by country/region #
| Country/region | Proportion of female tech workers (%) |
|---|---|
| Europe | 22% |
| Asia-Pacific | 22% |
| Global average | 23% |
| UK | 23% |
| US | 27% |
(Source: Nash Squared)
The average tech team worldwide contained less than a quarter (23%) of women in 2023, the same percentage as the average UK tech team. The average percentage of women on a US company’s tech team stood at just over a quarter (27%) – 4% more than the UK by comparison.
Women in tech startup founder statistics #
The most recent research by Startup Genome reveals that less than one in six (15%) founders in tech startups globally from 2022 were female. However, the number of surveyed start-ups with at least one female founder stood at just under a third (31%).
Percentage of female founders for tech startups around the world by region #
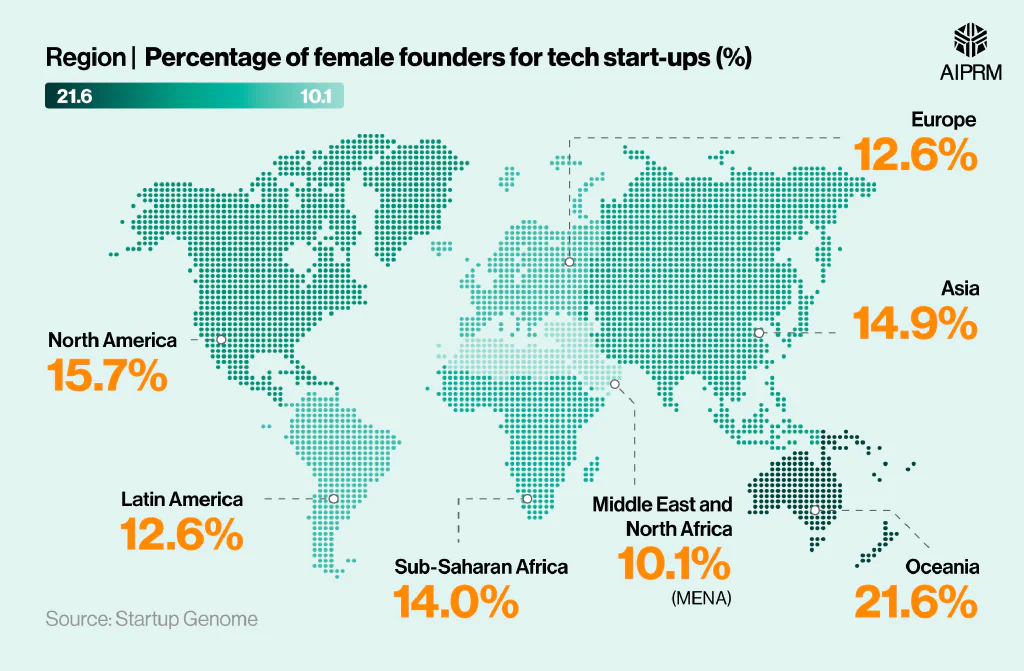
Women in tech statistics from Startup Genome indicate that Oceania has the largest proportion of female founders for tech startup companies at just over a fifth (21.6%). This is followed by North America (15.7%) and Asia (14.9%).
Incidentally, just over a tenth (10.1%) of tech startups in the Middle East and North Africa (MENA) are headed by females – less than half the proportion in Oceania.
Percentage of tech startups with at least one female founder by city/location #
In a survey of 5,469 startup founders around the world, only Brisbane and Manila had at least one female founder in more than 50% of their companies.
The majority of US cities in the study had a female founder in at least 30% of startups, with Chicago and Detroit averaging between 40-50%.
At the other end of the scale, eight of the ecosystems analyzed had fewer than 20% of startups with at least one female founder, including Edmonton (Canada) and Munich (Germany), both at 14%.
Percentage of women in tech by industry #
An analysis of women in tech stats by McKinsey & Company reveals that half (50%) of tech roles in Europe’s social network industry are occupied by women – the largest percentage across all tech-related industries.
Average percentage share of women in tech companies across Europe by industry #
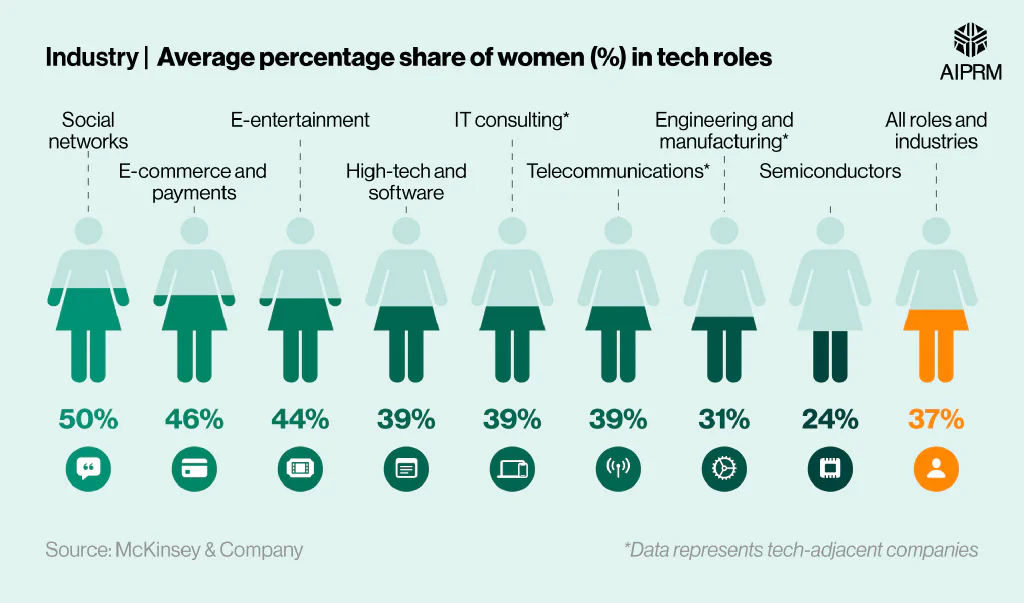
The percentage of females in tech roles across all industries stands at just under two-fifths (37%), with those in e-commerce and payments and e-entertainment faring better at 46% and 44%, respectively.
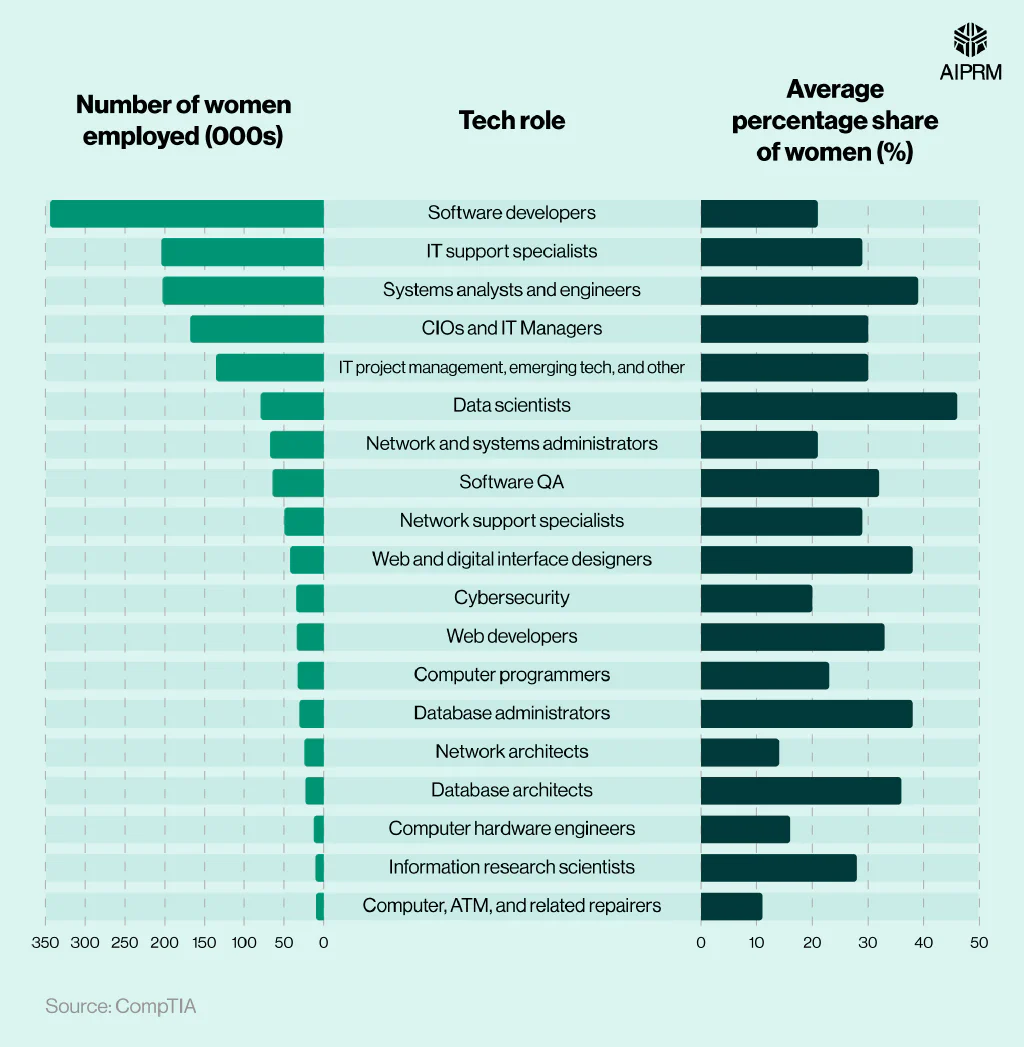
Percentage of women in tech by job type #
According to the latest ‘State of Tech Workforce Report’ by CompTIA, around 343,889 women across the US were employed as software developers as of 2023-24. This was the highest number of women employed across all US tech roles for the year, which means that around one in five (21%) American software developers are women.
By contrast, 202,961 women were employed as systems analysts and engineers as of 2023-24. Yet, this accounted for just under two-fifths (39%) of the US workforce in this position.
Average percentage share of women in tech roles across the US #
| Tech role | Number of women employed | Average percentage share of women (%) |
|---|---|---|
| Software developers | 343,889 | 21% |
| IT support specialists | 204,679 | 29% |
| Systems analysts and engineers | 202,961 | 39% |
| CIOs and IT managers | 167,964 | 30% |
| IT project management, emerging tech, and other | 135,448 | 30% |
| Data scientists | 79,249 | 46% |
| Network and systems administrators | 67,636 | 21% |
| Software QA | 64,606 | 32% |
| Network support specialists | 49,360 | 29% |
| Web and digital interface designers | 42,504 | 38% |
| Cybersecurity | 34,736 | 20% |
| Web developers | 33,979 | 33% |
| Computer programmers | 32,847 | 23% |
| Database administrators | 30,791 | 38% |
| Network architects | 24,281 | 14% |
| Database architects | 22,872 | 36% |
| Computer hardware engineers | 12,766 | 16% |
| Information research scientists | 10,663 | 28% |
| Computer, ATM, other related repairers | 9,880 | 11% |
(Source: CompTIA)
The largest percentage of women in tech roles across the US can be found working as data scientists, where just under half (46%) of people in this role across the country are female.
Incidentally, the tech roles with the lowest number of women employed in 2023-24 were computer, ATM, and other related repairers, at just 9,880 combined. This was almost 35 times less than the number of female software developers, accounting for just over a tenth (11%) of workers in this field.
As of 2023, women occupied around a fifth (22%) of all tech roles across Europe, according to research by McKinsey & Company.
Just under half (46%) of Europeans employed in product design and management roles are women – the highest female percentage share across all tech-related job titles.
Average percentage of women in tech roles across Europe #
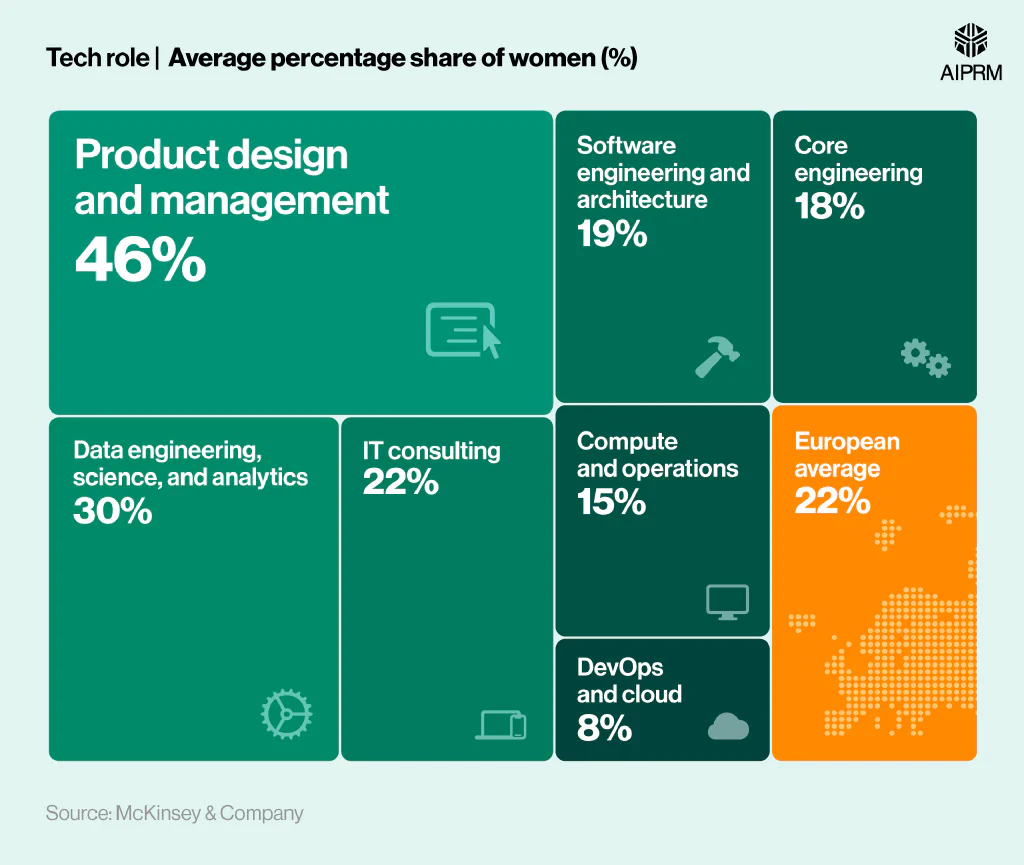
This is followed by less than a third (30%) of those in data engineering, science, and analytics roles and just over a fifth (22%) working in IT consulting.
Women in DevOps and cloud-based jobs are the least represented in the workplace across Europe, accounting for less than one in 10 (8%) employees in these roles.
Average percentage share of women in tech roles across Europe by job title #
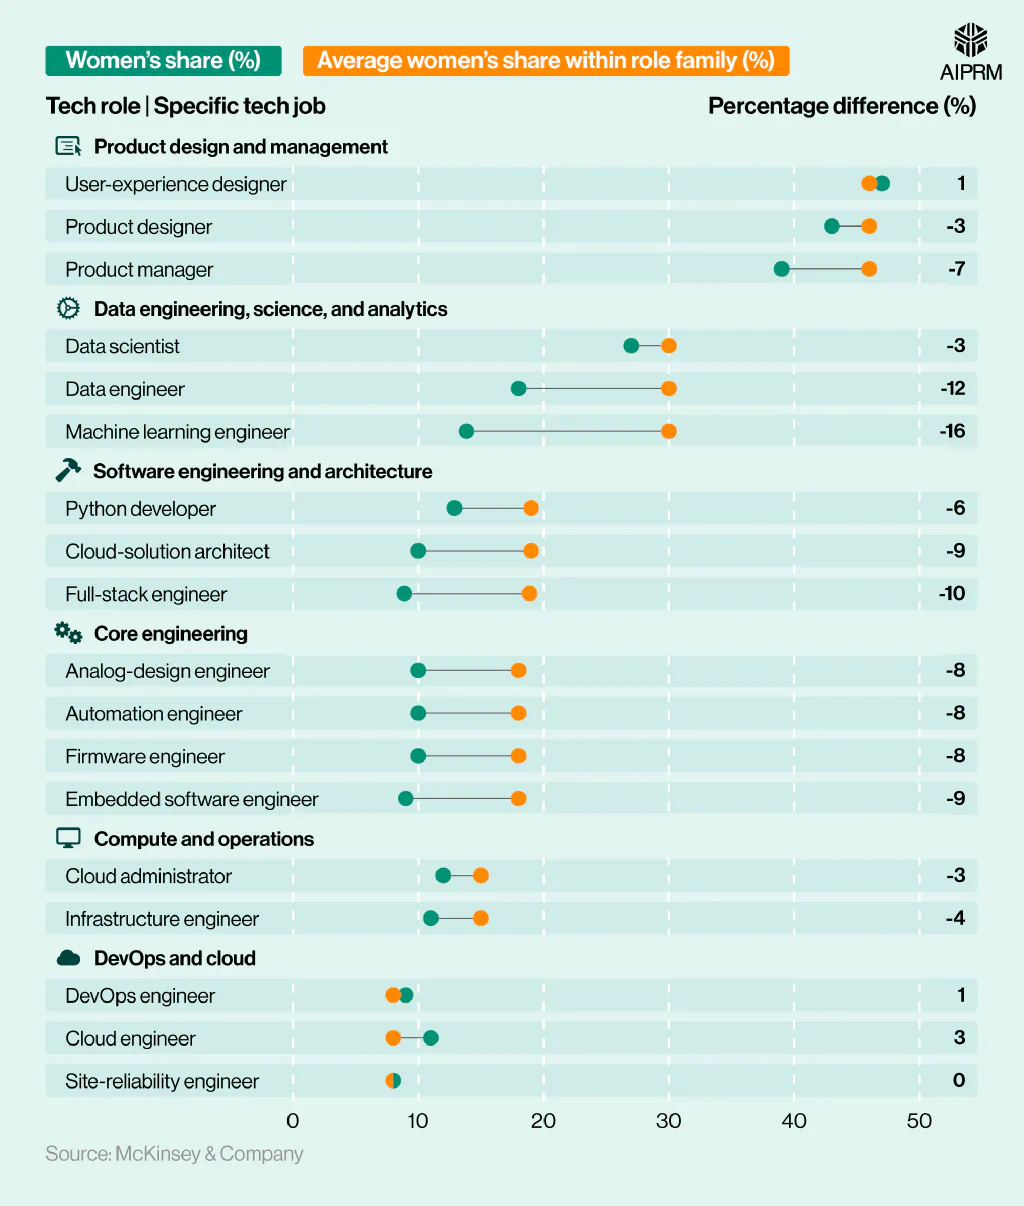
Just under half (47%) of Europeans employed as user-experience designers are women – the highest percentage across all specific tech jobs in 2022. This is followed by just over two-fifths (43%) of product designers and less than two in five (39%) female product managers.
Around a seventh (14%) of European machine learning engineers were female. This was 16% less than the average percentage of women in tech roles for this family of jobs – the largest percentage difference of all tech positions in Europe for the year.
Percentage of women in tech across big tech companies #
As of 2022, less than half (45%) of Amazon’s total workforce were women – the highest reported percentage across ‘The Big Five’ tech companies. This was 8% more than Facebook and 11% more than Apple (as a proportion of their respective workforce).
Representation of women working in big tech companies #
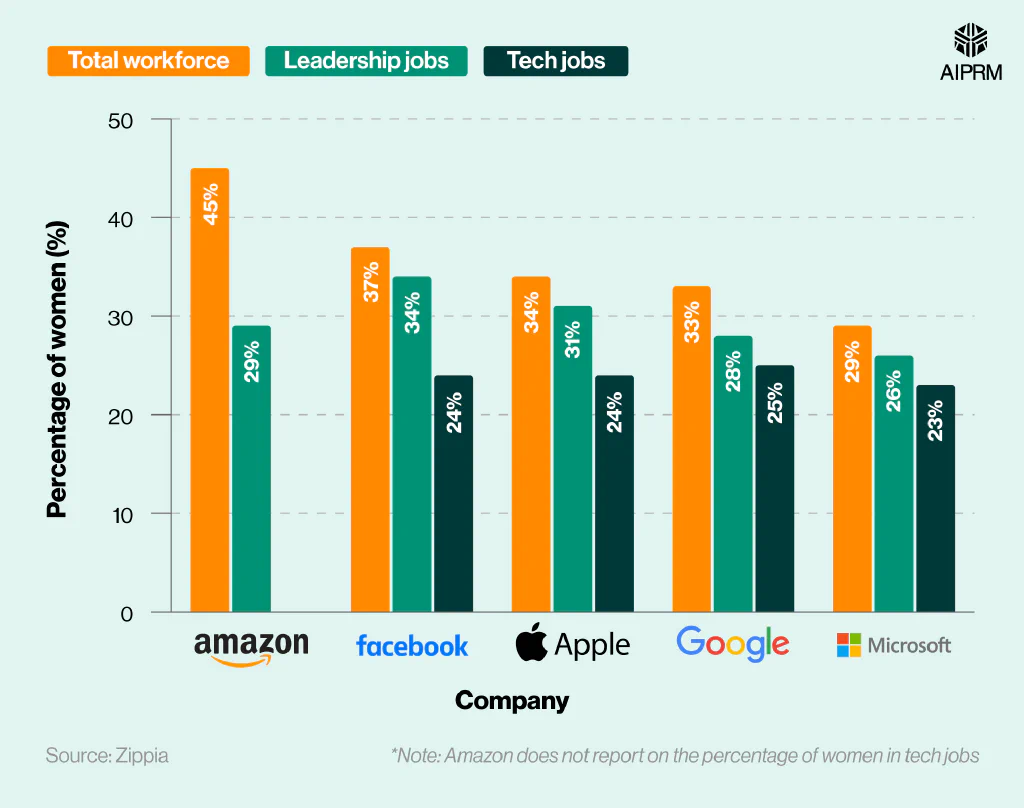
Facebook was marginally ahead in terms of employing women in leadership roles, with more than a third (34%) of females in these positions in 2022. This was followed by less than a third for Apple and Amazon (31% vs 29%, respectively).
Generally speaking, around a quarter of all tech jobs at ‘The Big Five’ are occupied by females, with Amazon being the only one that doesn’t specifically report on the percentage of women in tech roles.
Women in tech across Europe #
As of 2024, Luxembourg had the largest percentage of women working in tech across all European countries, with around three-quarters (74.5%) of the active working female population employed in a tech-related job. This was closely followed by Iceland (74.2%).
If current trends continue, then nearly four in five (79.4%) working women in Luxembourg will be employed in a tech role by 2029. Ireland should overtake Iceland in second place by 2027, with their total projected to surpass three-quarters (75.4%) that year.
The percentage of women working in tech across Europe (2013-29) #
Note: This represents the percentage of women working in tech as a proportion of the active female working population.
At the other end of the scale, Romania had the lowest percentage of women working in tech as of 2024, with just over two in five (40.2%) actively working females employed in tech jobs. By 2029, this figure is predicted to rise by nearly 5%, yet it will likely still be the lowest proportion across all EU countries.
Percentage difference in the number of European female tech workers by country (2013-24) #
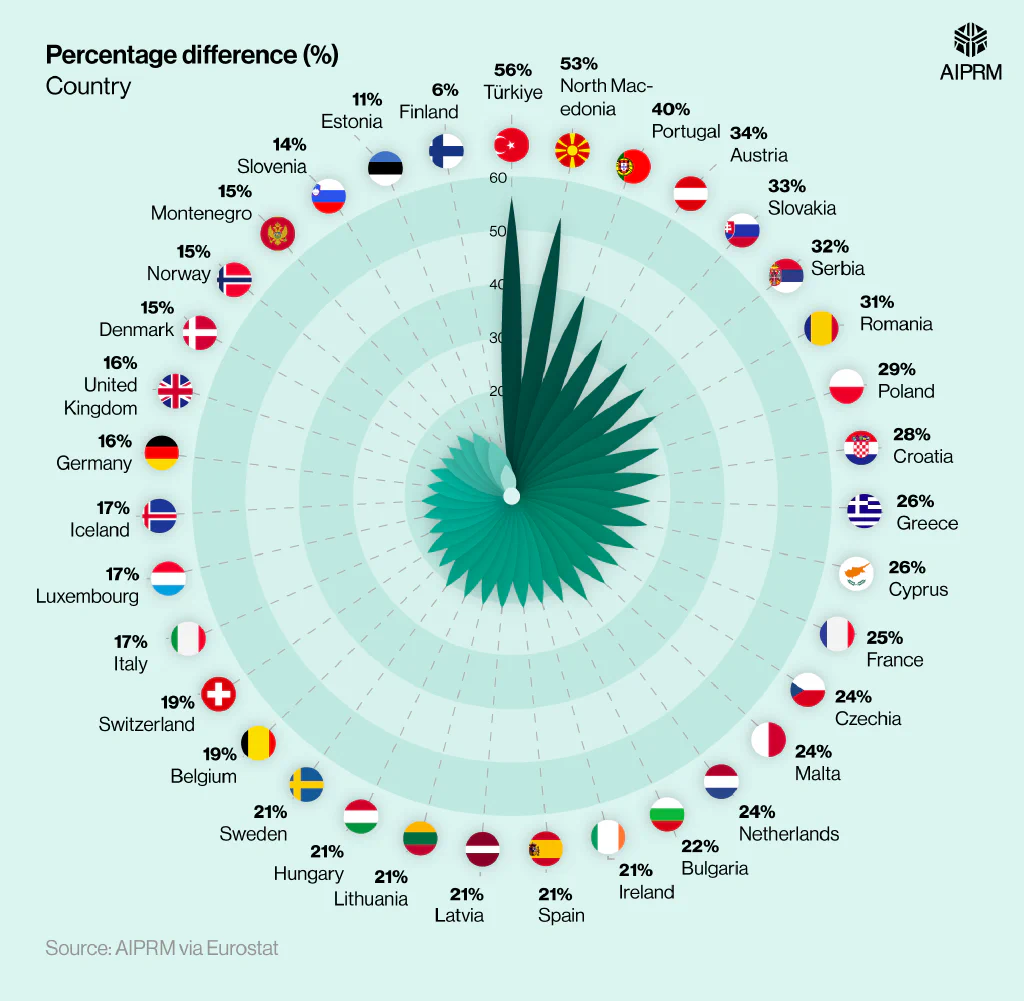
Between 2013-24, Türkiye saw the biggest percentage difference in the proportion of women employed in tech, with a rise of more than half (56%) over 11 years. This was followed by North Macedonia, which saw its working female tech population increase by 53% at the same time.
Conversely, Finland and Estonia both saw the smallest percentage change in the proportion of female tech workers between 2013-24, at 6% and 11%, respectively.
Percentage of women in tech roles in Europe between 2022-27, broken down by intervention method #
| Year | Est. number of women in tech roles (mn) | Reframe (mn) | Retain (mn) | Redeploy (mn) | Ramp up (mn) |
|---|---|---|---|---|---|
| 2022 | 2.0 | ||||
| 2027 (Do nothing) | 2.1 | ||||
| 2027 (With interventions) | Between 3.72 - 6.05 | 0.48 - 1.0 | 0.37 - 0.44 | 0.53 - 1.8 | 0.24 - 0.71 |
(Source: McKinsey & Company)
A study by McKinsey & Company estimates that around two million women were employed in the European tech industry as of 2022. With no interventions to try and boost this figure, the number of women working in tech roles in 2027 is expected to reach 2.1 million – an increase of 5% in five years.
However, by implementing various strategies to increase the number of women employed in tech jobs, this number could more than triple by 2027 (+202.5%). The study also states that, with the right interventions, the share of women in tech roles across Europe could rise from 22% to 45% by 2027.
Reframing #
An analysis of women in tech stats suggests that European companies could increase the number of females in tech roles by 480,000 to one million by addressing the pain points and needs of women in the workplace.
According to survey data from McKinsey & Company, around seven in 10 (70%) women in tech still feel they need to work harder to prove themselves because of their gender. Therefore, reducing the isolation of women in the tech industry and building support networks where they feel equally as valued as their male counterparts should help boost employment figures across the field.
Furthermore, having greater flexibility in the workplace could go a long way to addressing women’s needs in the tech industry. Around 7% of European women are out of the workforce due to caregiving responsibilities at home (compared to just 0.5% of men). In addition, almost a quarter of women cite a lack of work-life balance as a primary reason for leaving their tech careers.
Introducing strategies, such as offering remote or hybrid working, greater flexibility in working hours, and on-site childcare facilities, could help address this imbalance.
Retaining #
More than half of women in tech leave the industry by the midpoint of their career – around double the rate for men. This would help explain why fewer women are in leadership roles across the sector.
By improving retention rates of women in tech, European companies could boost the number of women in tech roles by 370,000 to 440,000 by 2027.

A study by the Integrating Women Leaders Foundation found that more than three-quarters (77%) of executive men believed they were active allies for gender equality in the workplace. Yet, less than half (45%) of women executives agreed this was the case in reality.
This is supported by McKinsey & Company research that suggests four-fifths (80%) of women in tech who aspire for better roles feel they need to change employers to achieve this. Therefore, offering flexible career paths and working with women in their career development could help tech organizations retain more women.
Redeployment #
By 2027, businesses could increase the number of women in tech roles by 530,000 to 1.8 million by hiring females from untapped pools and training them in modern technologies to build up their tech skills.
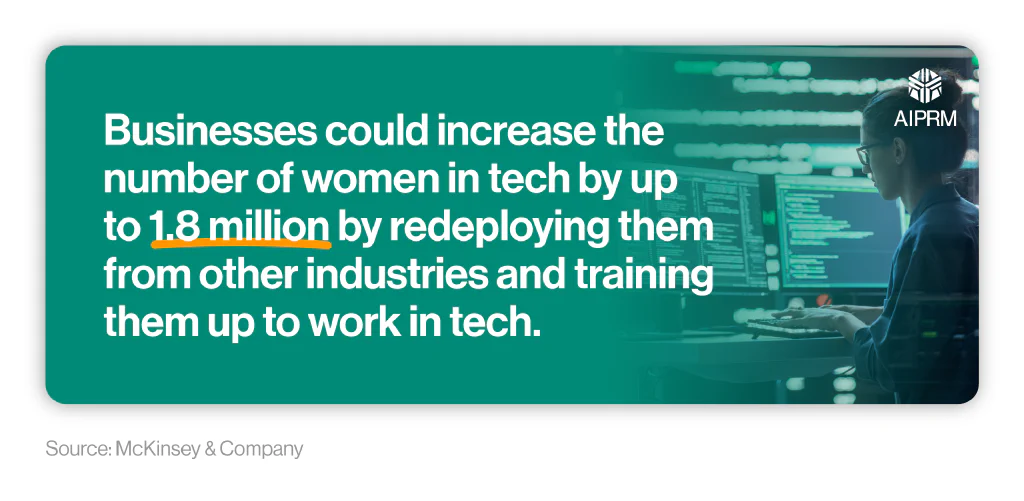
In a study of more than one million profiles across European tech companies, more than two-fifths (44%) of women came from non-STEM educational backgrounds and learned on the job compared to just over a quarter (26%) of men.
Ramping up #
McKinsey & Company estimates that if countries could increase the number of women enrolling in STEM subjects at university by around 1% (around 300,000 women), this would only result in an additional 15,000 women working in the tech industry by 2027.
They suggest that programs supporting women already in STEM degrees could have a bigger impact, such as:
- Providing more and better internship opportunities
- Offering mentoring and coaching as women prepare to take up employment
- Actively recruiting women to work on cutting-edge projects in leadership roles.
It’s estimated that adopting these practices could increase the number of women in tech by as many as 695,000 by 2027.
Tech industry demographics #
Research reported by GEO20 suggests that the proportion of US women working in tech in 1984 stood at just over a third (35%). By 2023, this number had dropped to 32%.
Additionally, Forbes reported that the number of female tech leaders had dropped by a similar rate, from 35% in 1984 to 32% in 2022. The same report claims that this number fell to 28% in 2023.
Accenture’s ‘Resetting Tech Culture’ report from 2020 also found that:
- Women held approximately one in six (16%) engineering roles and just over a quarter (27%) of computing jobs across all US tech companies.
- Around half (50%) of women in tech leave their role by age 35, compared to approximately a fifth (20%) in other job types.
- Around a fifth (21%) of women in tech say it’s “easy for women to thrive” in the industry, compared to just under half (45%) of senior HR leaders in tech companies.
Findings from the 2023 ‘Women in Tech’ survey support these trends, with around nine in 10 people (91%) of the opinion that there are more men in tech than women – a 9% increase from 2019. Furthermore, almost four in five people (79%) agree there is a gender pay gap in the tech sector, with only 8% believing it is equal.
Potential increase in the number of women in tech across the US by 2030 #
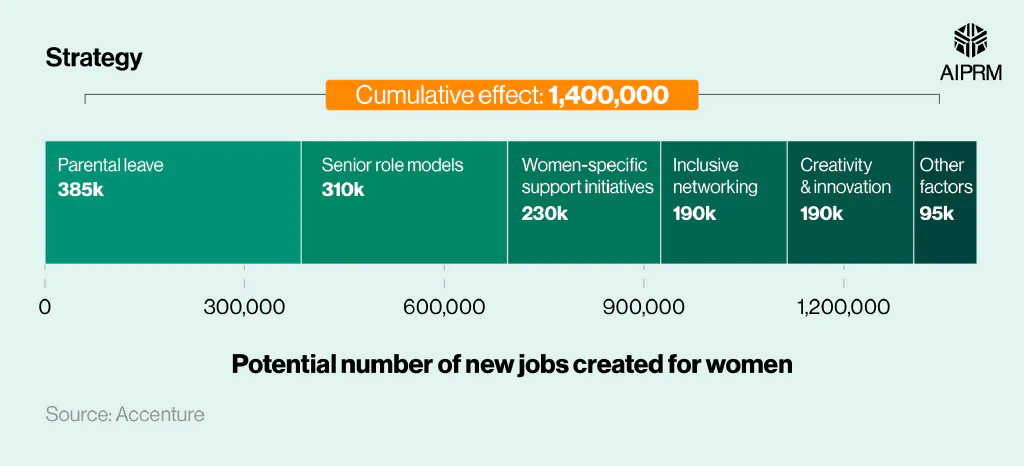
By 2030, Accenture forecasts that an additional 1.4 million new jobs could be created for women in the tech industry, should organizations adopt five key cultural practices. They are:
- Inclusive networking
- Creativity and innovation
- Women-specific support initiatives
- Senior role models
- Parental leave
More than a quarter (27.5%) of these job opportunities could be generated by reevaluating parental leave strategies for those women working in tech, with around a fifth (22.1%) more jobs created by having more women as senior role models.
Women in tech education statistics #
When comparing the experiences of women in a more inclusive college compared to a less inclusive setting, Accenture found that women were:
- 20 percentage points (pp) more likely to see a clear pathway between their studies and a career.
- Over 20pp more likely to look for a tech-related job after college (+21pp).
- Nearly twice as likely to feel comfortable asking questions (+37pp).
- Five times less likely to feel like an outsider.
Statistics on the experiences of women in tech during college #
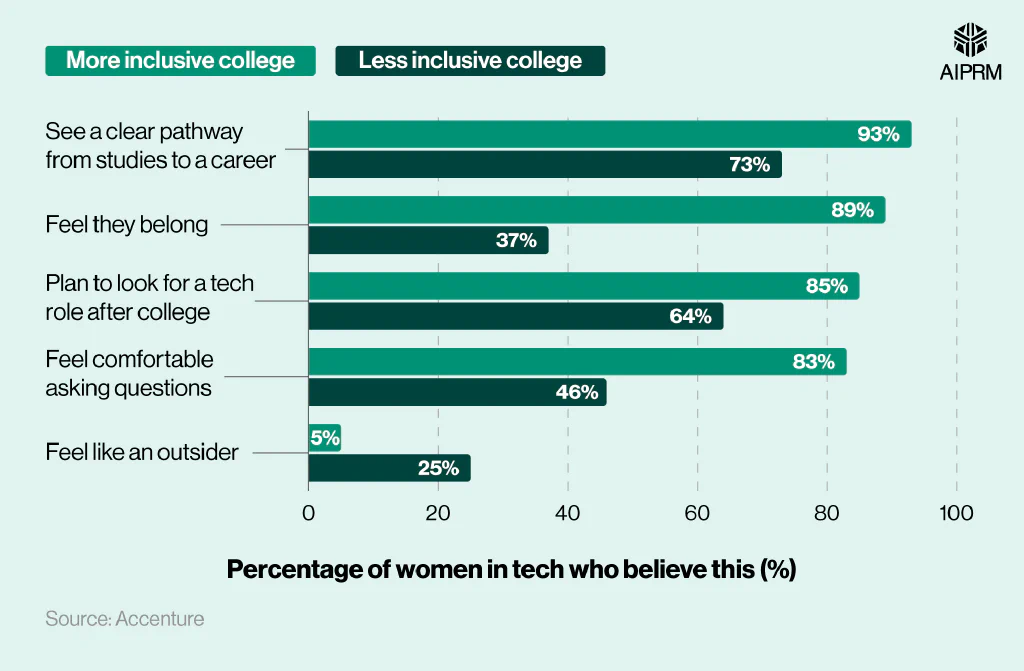
The chance of having a sense of belonging also more than doubled (+52pp) for women studying in an inclusive college compared to those who weren’t.
Diversity in tech statistics for women #
According to diversity in tech statistics from McKinsey & Company, the percentage of Black, Latina, and Native American (BLNA) women in tech across the US dropped between 2018-22 from 4.6% to 4.1%.
This is perhaps unsurprising given that two in five (40%) Black, Latina, and Native American (BLNA) women also reported prejudice related to gender or race in the workplace.
Diversity gap for women in tech #
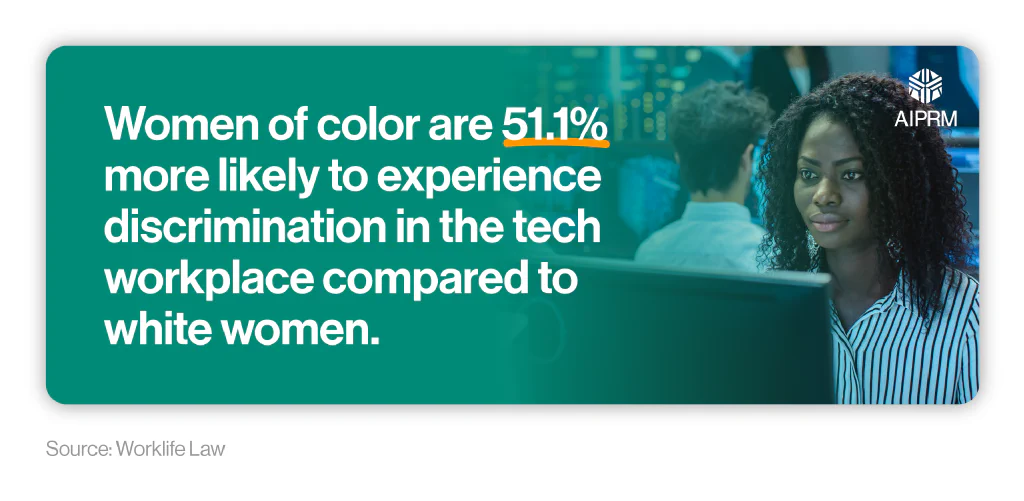
A 2022 study by Worklife Law found that women of color were 51.1% more likely to face negative or racial stereotypes at work compared to white women – the largest percentage point difference between the two races across all patterns of bias analyzed.
Diversity in tech statistics (women of color vs. white women) #
| Pattern of bias | Example | Percentage point difference (%) |
|---|---|---|
| Prove-it-again | Prove themselves repeatedly to get the same kind of respect and recognition for their work | +23.4% |
| Tightrope | More likely to report being interrupted | +17.9% |
| More likely to get negative reactions to justified anger | +13.3% | |
| Maternal wall | Diminished perception of their competence and commitment post-children | +16.4% |
| Tug of war | More likely to be worried if they support another member of their group as it would be construed as favoritism | +19.1% |
| Distinct experiences | Faced negative or racial stereotypes at work | +51.1% |
| Workplace systems | Getting the promotions they deserved | -10.1% |
| Getting paid less than similarly situated colleagues | +22.3% |
(Source: Worklife Law)
Black women were almost a quarter (+23.4%) more likely to have to prove themselves to get the same level of respect/recognition for their work, with around one in five (22.3%) claiming they were getting paid less than white colleagues in a similar position.
Other stats from the Worklife Law report indicate that:
- More than two-thirds of women of color reported some form of sexual harassment in the tech workplace.
- Nearly a quarter reported unwanted physical contact.
- Almost 10% reported having lost opportunities (like promotions or career-enhancing assignments) due to sexual harassment.
A report by The Fawcett Society also pointed to several trends when it came to the experiences of black and minoritized women in the UK tech industry:
- Almost three-quarters (72%) experienced racism at work, with a similar percentage (73%) of disabled women reporting issues of ableism in the workplace.
- Around one in three (33%) Black women have been assumed by colleagues to not hold a technical role within their company compared to just under a fifth of white or Asian women (19% for each).
- Black women are less likely to report a fair and unbiased recruitment process when it comes to tech employment (57% vs. 67% for white women).
- Almost a fifth (18%) reported being made to feel uncomfortable about their ethnicity during an application.
- Black and minoritized women were almost three times more likely than white women to cite the working culture in tech as not being inclusive (22% vs. 8%).
Analysis by Accenture indicates that just over a quarter (28%) of women advance to a managerial role in companies classed as having the ‘least inclusive’ culture (i.e. not seen to actively promote equality between all staff). This is contrasted by around two-fifths (40%) of men.
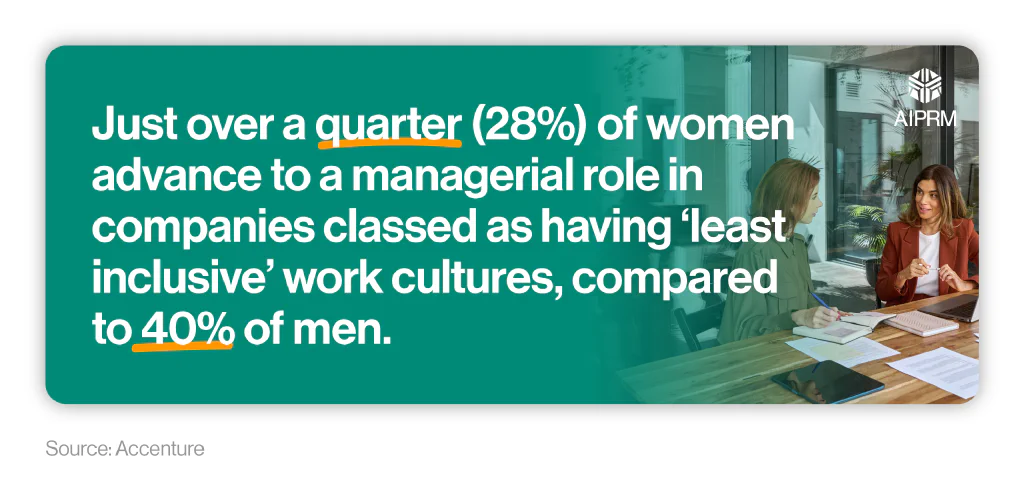
That said, when working for a company with a high level of inclusivity, the number of women advancing to managerial roles rises to 45%.
Their report also found that:
- Less than two-fifths (38%) of senior HR managers surveyed believe that building a more inclusive culture is an effective way to retain and advance women in tech roles.
- Only a quarter (25%) of tech graduates are women, with a dropout rate of almost two-fifths (37%) for tech classes and just under a third (30%) for other programs.
- Women of color in college tech programs are more likely to participate in women’s networks than other females at the same school (63% vs. 50%).
- Lesbian, bisexual, and transgender (LBT) women who major in tech also have a more positive experience when working in a more inclusive setting.
Statistics on the experiences of women in tech during college #
| Experience | Percentage of women of color who believe this (less inclusive college) | Percentage of women who believe this (less inclusive college) | Percentage of women of color who believe this (more inclusive college) | Percentage of women who believe this (more inclusive college) |
|---|---|---|---|---|
| Found classes inspiring | 55% | 67% | 90% | 90% |
| See a clear career path from studying tech, engineering, or math | 67% | 79% | 92% | 94% |
(Source: Accenture)
Accenture also found that women of color tend to be less inspired by their classes in a less inclusive college compared to other women (55% vs. 67%). When situated in a more inclusive setting, this figure jumps to nine in 10 (90%) who feel inspired by their lessons.
Furthermore, just over two-thirds (67%) of women of color in a less inclusive college claim they see a clear path to a career in tech once they graduate, compared to just under four-fifths (79%) of all women. The corresponding figures for a more inclusive college environment stand at 92% and 94%, respectively.
Tech industry demographics by location #
According to a 2024 ‘State of the Tech Workforce’ report by CompTIA, females constituted just over a quarter (27%) of all US tech occupations, compared to just under half (49%) of all jobs in the US.
According to BLS data, the median weekly earnings for a woman in tech in 2023 was $1,005 – around 16% less than the typical male tech worker.
As a result, the typical American woman in tech earned around 83.6% compared to her male counterparts for the year.
Index study: Top 10 US states for women in tech #
| State | Number of female tech workers (000s) | Median weekly earnings ($) | Women's earnings as a percentage of men's | Percentage change in employment (male vs. female) | Index score (/10) |
|---|---|---|---|---|---|
| Maryland | 1,142 | 1,296 | 88.5 | -12% | 9.14 |
| Massachusetts | 1,211 | 1,331 | 87.2 | -15% | 8.96 |
| New York | 3,200 | 1,090 | 84.2 | -13% | 8.93 |
| California | 5,839 | 1,118 | 89.9 | -24% | 8.58 |
| Connecticut | 600 | 1,194 | 88.2 | -15% | 8.49 |
| Florida | 3,822 | 926 | 87.9 | -14% | 8.49 |
| Georgia | 1,810 | 976 | 88.5 | -16% | 8.46 |
| District of Columbia | 160 | 1,726 | 86.6 | 3% | 8.44 |
| Illinois | 2,080 | 1,055 | 83.6 | -17% | 8.18 |
| North Carolina | 1,853 | 904 | 85.8 | -12% | 8.17 |
(Source: AIPRM via BLS)
AIPRM’s analysis of women in tech statistics reveals that Maryland is the best US state for women in tech, with an index score of 9.14 out of 10. Female tech workers in Maryland can expect to earn $1,296 per week – over a quarter (29%) more than the national median wage for women in tech. This equates to around 88.5% of what a typical male tech worker can expect to earn in Maryland.
Massachusetts, in second place, has the highest median weekly earnings for women in tech across all US states at $1,331. This is around 2.7% more than the typical female tech worker in Maryland and almost a third (32.4%) higher than the national median wage for women in tech.

The smallest gender pay gap for female tech workers is in California, where women earn nearly 90% of what typical males earn in the industry. This is in contrast to Louisiana, which had the largest gender pay gap for tech in 2023, with women workers earning 73.7% of the typical man. This means Louisiana women in tech typically earn less than three-quarters compared to men in the same sector.
As of 2023, the biggest gender gap in tech employment figures across US states was in Utah, where approximately two-fifths (40%) fewer women work in technology-based jobs compared to men.
The District of Columbia is the only US state with more female tech workers than males (+3%). Yet, women here typically still only earn 86.6% compared to men.
Percentage of women in tech by US state #
When broken down by state, the District of Columbia comes out with the highest percentage of women in tech jobs, with just under a third (33%) of all tech occupations occupied by females.
This is followed closely by Maine (31%) and South Carolina (31%).
Conversely, Utah had the lowest proportion of women employed in tech-related jobs in 2024, at just over a fifth (22%).
Women in tech hybrid working statistics #
An analysis of Deloitte’s ‘Women @ Work’ report suggests that more than half (51%) of women working in tech, media, and telecoms (TMT) jobs globally are already working in a hybrid capacity. This is compared to just over two-fifths (43%) of non-TMT women.
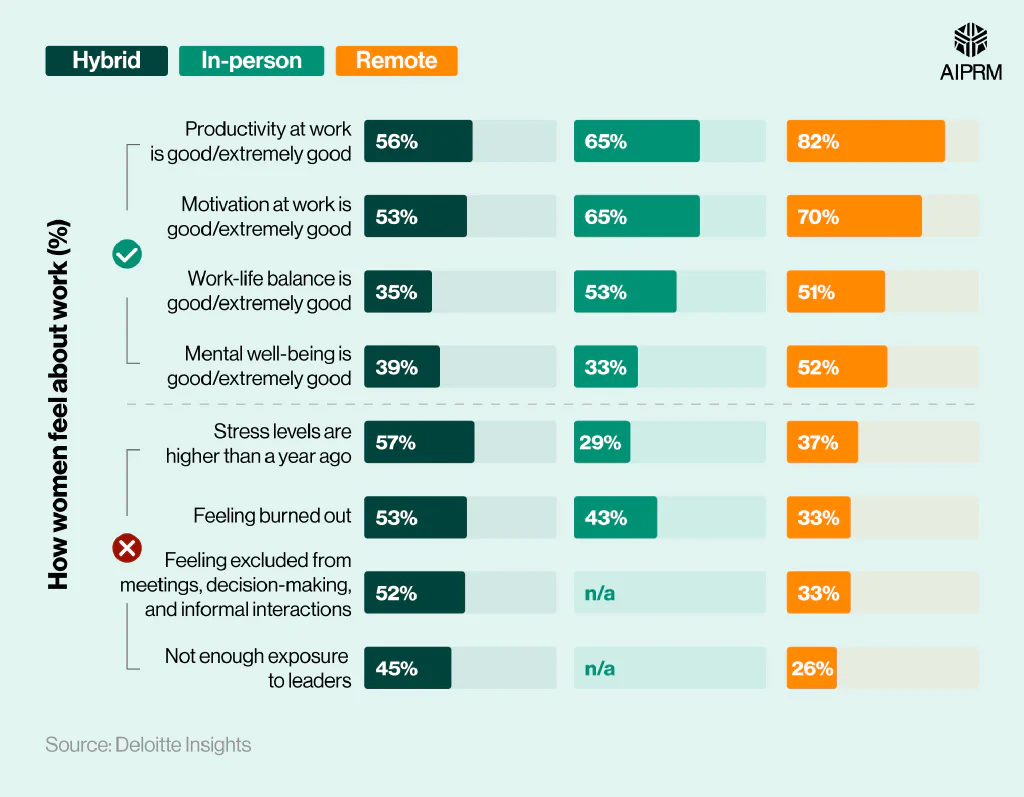
However, as the results of their survey show, hybrid-working TMT women believe their productivity is worse by comparison. Less than three-fifths (56%) rated it as good/extremely good compared to almost two-thirds (65%) of those who work in-person and more than four-fifths (82%) for remote workers.
How women in tech, media, and telecommunication (TMT) feel about hybrid working compared to in-person or remote working females #
Other findings from Deloitte’s ‘Women in Tech’ survey indicate that:
- Just over half (53%) feel motivated with a hybrid work model compared to almost two-thirds (65%) of those working in-person and seven in 10 (70%) of those working remotely.
- Approximately a third (35%) of those in hybrid employment think they have a good work-life balance, compared to more than half of those in an in-person (53%) or remote (51%) environment.
- Those who work in a hybrid role are around twice as likely to have experienced increased stress compared to the previous year as those who work in the office full-time.
- More than half (53%) of hybrid TMT women feel burned out – compared to around two-fifths (43%) of in-person workers and a third (33%) of those working remotely.
Incidentally, more than half (52%) of hybrid workers felt excluded from meetings – almost 20 percentage points more than remote employees.
Gender gap in tech industry statistics #
The Fawcett Society is one of the UK’s leading charities campaigning for gender equality and women’s rights in the workplace.
According to their 2023 report:
- Around one in five men (19%) working in tech jobs believe the most significant reason why there are fewer women in tech than men is that women are ‘naturally less suited to working in the sector’.
- Just over a quarter (26%) of men feel there is gender bias in recruitment.
- More than two-fifths (43%) of women in tech consider leaving their jobs at least once a week. This figure stands at just under three-fifths (57%) for those under 24, around half (51%) for bisexual and lesbian women, and almost three-fifths (59%) for disabled females.
- Almost three-quarters (72%) of women in tech roles have experienced at least one form of sexism in the workplace. This includes being on the receiving end of sexist banter (22%), being paid less than colleagues who do the same/similar job (22%), and people questioning their skills and abilities (20%).
- Just over a quarter (26%) agreed that there is more sexist behavior in the tech industry compared to other types of work.
The Fawcett Society also found that over a fifth (22%) of women wanting to leave their tech role cited looking after children or others with caring responsibilities as their primary reason, with the same number citing a lack of progression opportunities.
Just over half (53%) of women surveyed felt they did not know how to get a tech role or enter the field, with almost a third (32%) of women outside of tech believing they needed a university degree to work in the tech industry.
On a more positive note, more than two-thirds (68%) of women in tech agreed that their employer provides opportunities for flexible working.
Most common reasons why women may be put off from working in the tech industry #
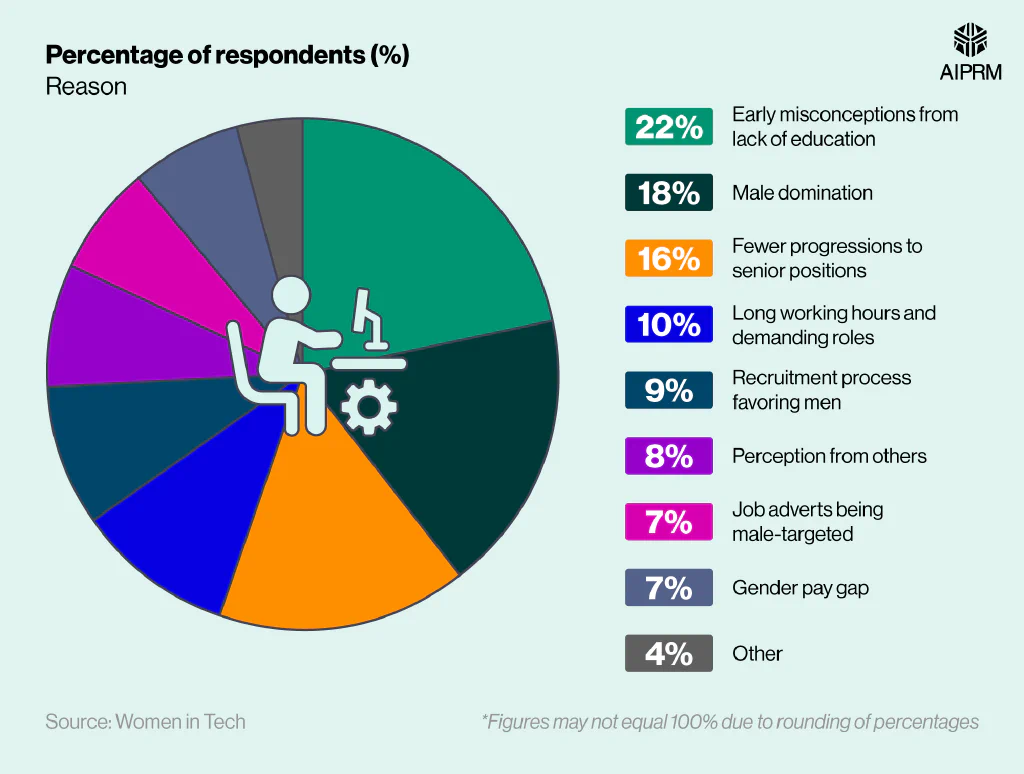
The Women in Tech Survey 2023 indicates that the most common reason women may be put off from working in the tech industry is early misconceptions resulting from a lack of education (22%).
This is followed by just under a fifth (18%) who feel the tech industry is too male-dominated and around a sixth (16%) who believe there are fewer progression opportunities for women to reach senior positions.
The survey also highlighted that around three-quarters (76%) of women have experienced gender bias or discrimination in the workplace at least once – almost a quarter (+24%) increase from 2019. This could also help explain why a tech gender gap still exists in 2024.
When questioned, approximately nine in 10 (90%) believe the sector would benefit from a gender-equal workforce. Furthermore, more than four in five (84%) would be drawn to a company that speaks about diversity and inclusion.
On a positive note, around three in five women (61%) claim their organization is actively working to close the gender gap in tech – compared to just over a third (36%) in 2019 – highlighting the steps companies have taken to identify and help rectify the issue.
Most important factors influencing the job satisfaction of women in the tech industry #
| Factor | Percentage of respondents (%) |
|---|---|
| Job security | 74% |
| Employee benefits | 68% |
| Work-life balance | 66% |
| Managerial support | 58% |
| Diversity, equality, and inclusion | 54% |
(Source: Forbes)
Overall, around three in four (77%) tech women surveyed by Forbes reported feeling somewhat satisfied or extremely satisfied at work.
When it comes to job satisfaction of women in the tech industry, the most important factor is job security, which is quoted by almost three-quarters (74%) of female respondents. This was followed by around two-thirds who believe employee benefits are a significant contributor to job satisfaction (68%) or maintaining a work-life balance (66%).
Did you know?
According to McKinsey & Company, closing the gender gap in tech could add an estimated $12 trillion to global GDP by 2025.
How long do you think it will be until gender diversity in tech is equal? #
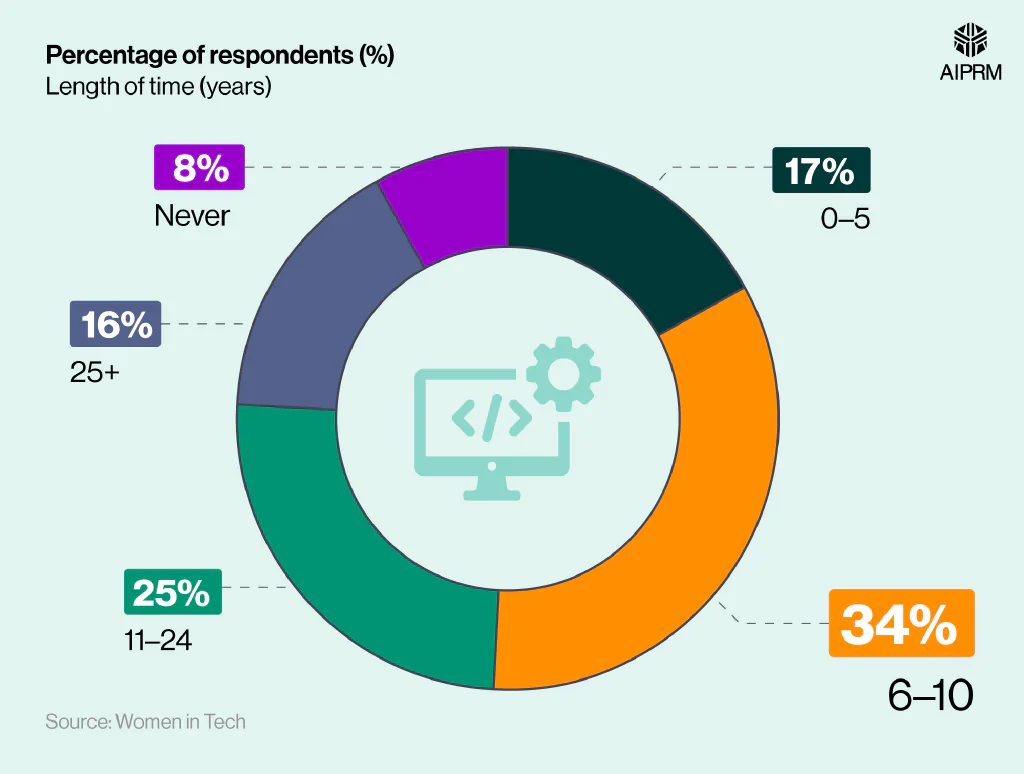
When asked how long it will take for gender diversity in tech to be equal, more than a third (34%) of women believe it will take six to 10 years.
Around a quarter (25%) feel that men and women in the tech workplace will be equal within the next 11-24 years. Less than a fifth think it could take 0-5 years (17%), with a similar number believing it could take more than 25 years to close the gap (16%).
Incidentally, less than one in 10 women (8%) feel the gender diversity gap in tech will never be closed.
Women and AI in the tech workplace #
A key finding from Skillsoft’s ‘Women in Tech’ Report 2024 highlighted that learning about AI and gaining skills in this field is crucial for women to help narrow the gender gap in tech.
Their survey found that three-fifths (60%) of respondents were not yet using AI in their work. Of the 40% who are, around three-quarters (73%) reported feeling more productive, and almost a fifth (19%) found their work more streamlined with AI implementation.
According to the latest AI in the workplace statistics, three-quarters (75%) of companies plan to increase their use of AI by 2028, making it even more important for businesses to address this AI gender gap now before women fall even further behind their male counterparts in the tech workplace.

Recent AI statistics show that men generally have a higher level of AI awareness than women (38% vs. 23%, respectively).
Generative AI statistics also highlight a significant difference in the use of AI among men and women in 2024. A worldwide survey of 25,000 working adults found that just under three-fifths (59%) of men claim to use generative AI compared to just over half of women (51%).
If women use AI less than men and have a lower level of awareness, this could explain why they use AI less in the tech workplace and feel less confident.
Leveraging AI is a great way to give yourself a cutting edge in the workplace. AIPRM offers you a range of AI prompts to help you craft engaging content and greatly enhances your job prospects when it comes to working in the tech world.
Check out how to get started with AIPRM and how it can benefit you in the workplace.
Gender gap in tech by job level #
On average, there are around half (-53%) the number of women across the US employed in tech roles compared to men.
According to AIPRM’s analysis of US tech employment data from the BLS, the largest gender gap in US tech jobs is for mathematicians (-100%), where all 4,000 positions across the country are occupied by males. This is followed by computer network architects, where men occupied more than 90% of jobs in 2023.
Number of female workers in the tech industry in the US by tech occupation vs. males (2023) #
| Tech occupation | Number of male workers (000s) | Number of female workers (000s) | Percentage change (women vs. men) |
|---|---|---|---|
| Computer and mathematical occupations | 4,522 | 1,607 | -64% |
| Computer and information research scientists | 26 | 12 | -54% |
| Computer systems analysts | 291 | 195 | -33% |
| Information security analysts | 169 | 40 | -76% |
| Computer programmers | 300 | 75 | -75% |
| Software developers | 1,682 | 422 | -75% |
| Software quality assurance analysts and testers | 44 | 29 | -34% |
| Web developers | 49 | 8 | -84% |
| Web and digital interface designers | 30 | 29 | -3% |
| Computer support specialists | 454 | 162 | -64% |
| Database administrators and architects | 78 | 30 | -62% |
| Network and computer systems administrators | 169 | 30 | -82% |
| Computer network architects | 90 | 8 | -91% |
| Computer occupations, all other | 833 | 271 | -67% |
| Actuaries | 27 | 18 | -33% |
| Mathematicians | 4 | 0 | -100% |
| Operations research analysts | 65 | 77 | 18% |
| Statisticians | 25 | 18 | -28% |
| Other mathematical science occupations | 188 | 181 | -4% |
(Source: AIPRM via BLS)
Note: A negative value indicates that there are fewer women employed in that particular tech role compared to men, and a positive value indicates that more women are working in that job compared to men.
Males occupy the vast majority of tech jobs in the US except for operations research analysts, where more than half (54%) of positions are occupied by females. This results in a difference of +18% compared to men.
The US tech jobs with the closest percentage difference for men and women are web and digital interface designers (-3%) and other mathematical science occupations (-4%).
Percentage of women in tech by job type and level #
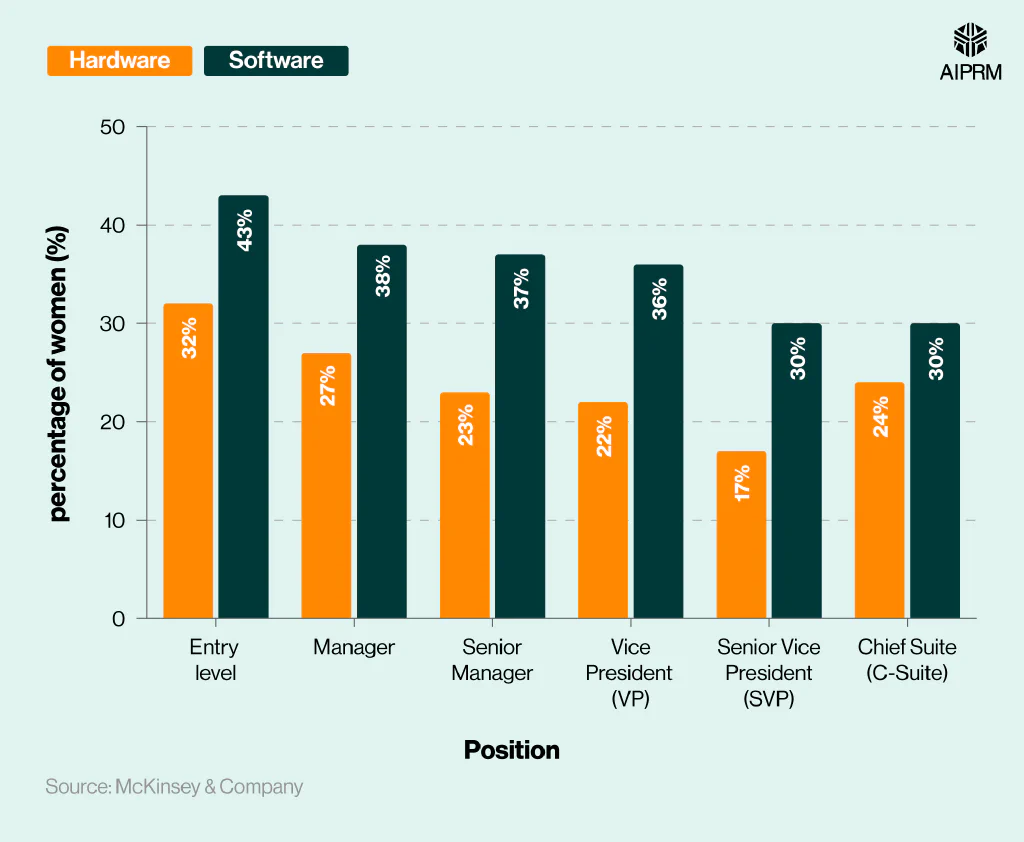
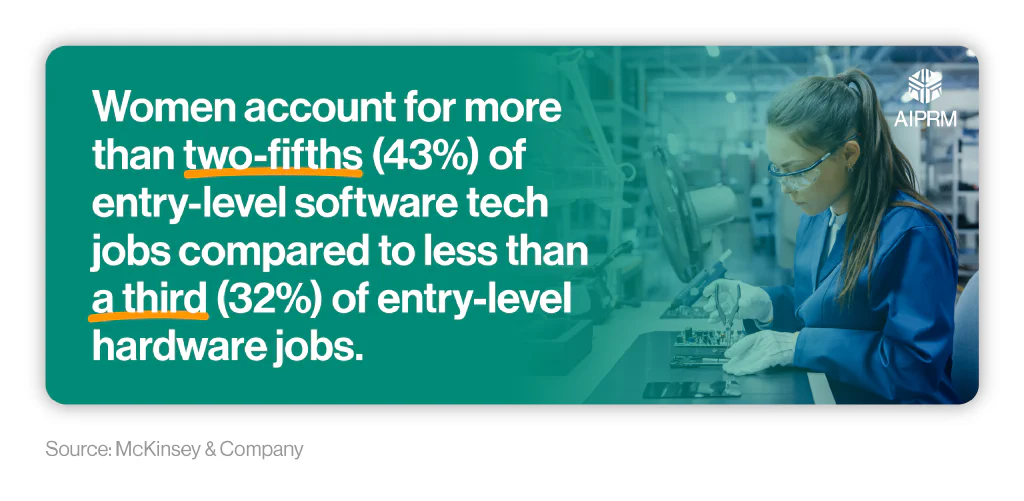
According to research by McKinsey & Company, the percentage of women in tech tends to be greater in the software industry compared to the hardware sector.
Women accounted for more than two-fifths (43%) of those employed in software technology entry-level jobs in 2023. This is 11% more than those in a similar position in the technology hardware industry.
Generally speaking, as the job level increases, the percentage of women employed in those positions decreases for both sectors. This falls to almost a sixth (17%) for Senior Vice President (SVP) roles in the technology hardware industry and less than a third (30%) for SVPs in software technology companies.
The exception to this trend is that almost a quarter of Chief Suite (C-Suite) positions in hardware technology organizations are held by women – 7% more than the proportion of female SVPs.
Research from Womentech Network found that senior leadership roles in tech had the greatest levels of disparity between men and women, with only a quarter (25%) of C-Suite leader positions occupied by women and just 5% by those from a racial minority. They also discovered that just 87 women and 82 women of color were promoted to manager for every 100 men promoted. This gap at the first step up from entry-level employment creates a significant shortage of female candidates for higher-level roles and further exacerbates the lack of representation within the industry.
Their poll also found that more than half (55%) of women lacked trust in their abilities, with more than a quarter (29%) citing an unclear career progression path.
Furthermore, less than one in 10 (8%) respondents identified a lack of skills as a hindrance to their promotion. This suggests more needs to be done to upskill women in the tech workplace and help them gain confidence when applying for higher-level positions.
Hiring trends and retention of women in the tech industry #
A survey by Womentech Network indicates that almost two-thirds (65%) of tech recruiters believe there is bias when it comes to hiring. A similar percentage (66%) of women claim their company lacks a clear path for career advancement.
According to their results, women are 1.6 times more likely to face layoffs in the tech industry than men, with almost seven in 10 (69.2%) tech layoffs in 2022 attributed to women.
Furthermore, almost three in five females (57%) in TMT roles plan to leave their jobs within two years, citing a poor work-life balance as the primary reason.

These findings are supported by Eightfold’s analysis of the gender gap in tech layoffs, which found that women comprise around three-fifths (61%) of all recruiter positions and 63% of marketing manager positions. Yet, for technical jobs, the corresponding figures are only one in four. When other factors are held constant (like industry, race, education, year, and experience), women are around 20% less likely to occupy a tech role compared to men.
As such, on average, women are two-thirds (+65%) more likely to be laid off than men in the tech industry.
Most common cultural issues faced by women in tech #
When contemplating joining or remaining with an organization, just under half (48%) of women executives prioritize flexibility as one of their top considerations, compared to just over a third (34%) of men.
Women are also 1.5 times more likely than males to change jobs because of a company’s dedication to diversity, equality, and inclusion (DE&I).
The Women in Tech Survey 2024 reveals that females often experience microaggression at work, particularly when it comes to their male counterparts.
For example:
- Almost two-thirds (64%) have been spoken over at meetings.
- Just under a fifth (19%) have felt pigeonholed by stereotypes in different situations.
- Around one in 10 (11%) have been asked to supply the food for meetings.
Furthermore, “gendered language” and “taking meeting minutes” were frequently referred to as usual practice by many of the survey respondents.
Gender gap in the tech industry by the success of companies led by women #
Of the top Fortune companies led by female CEOs, Oracle ranks sixth. With a relatively modest $49.95 billion in revenue for 2024, this does represent a rise of almost a fifth (+18%) from 2023 figures – the fifth-largest percentage across all companies on the list.
As a result, Oracle’s profits rose by more than a quarter (+27%) between 2023-24 – the seventh-highest percentage increase across all female-led Fortune companies.
Index study: The relative success of tech companies led by females compared to non-tech companies led by females #
By comparison, Freddie Mac came first in AIPRM’s index study of Fortune’s top female-led companies. Posting revenue figures of $108.5 billion in 2024, this represents over twice the amount for Oracle. Freddie Mac’s assets are also worth an estimated $3.28 trillion – almost 25 times more than Oracle by comparison – with annual profits of $10.54 billion in 2024 (the third highest in the study).
Incidentally, the other two tech companies run by female CEOs are positioned 18th and 22nd, respectively, on the list. Accenture employs more people than any other company in the study, with Luxshare Precision Industry having the lowest-valued assets of the female-led tech companies, at $22.82 billion. This is around 190 times less compared to Fannie Mae, which had the highest-valued assets in 2024 ($4.33 trillion).
Gender pay gap in tech statistics #
All eight of the US tech jobs analyzed by AIPRM reveal that men tend to earn more than women despite doing the same job. The percentage difference was greatest for operations research analysts, where females earn around a quarter (25%) less per week than males ($2,208 vs. $1,665, respectively).
Median weekly earnings of women in different tech jobs in the US vs. men (2023) #
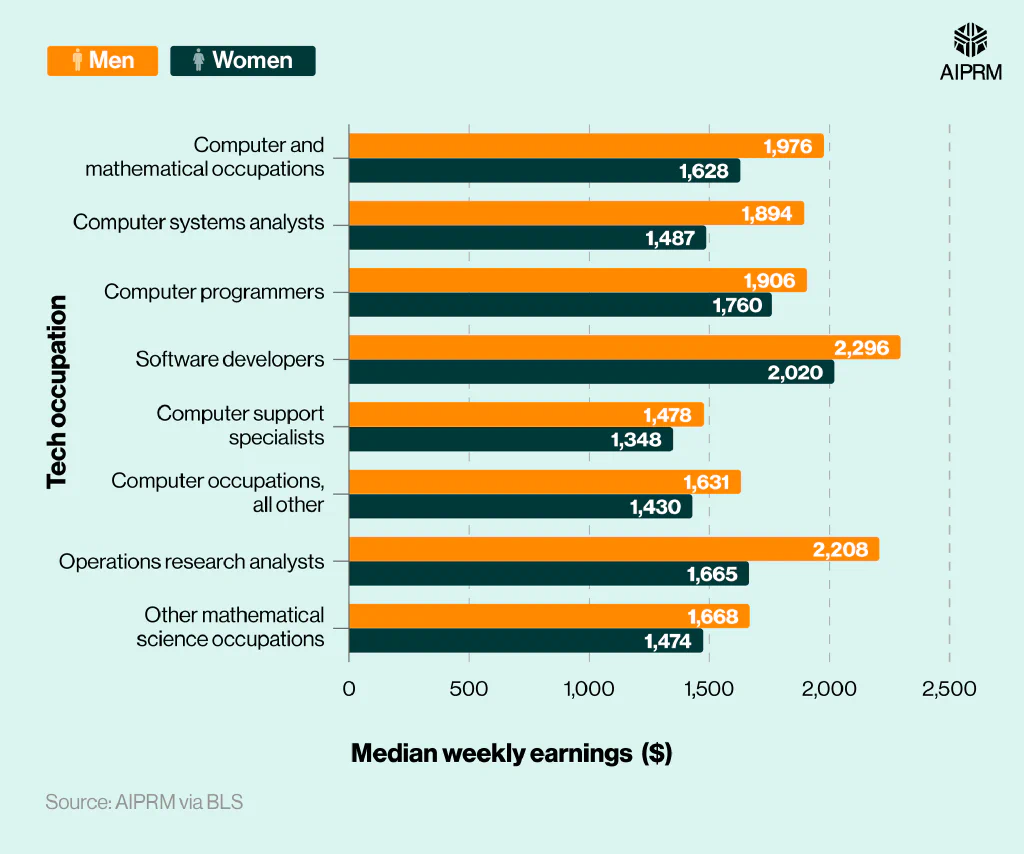
| Tech occupation | Median weekly earnings (overall) ($) | Median weekly earnings (men) ($) | Median weekly earnings (women) ($) | Percentage change (women vs. men) |
|---|---|---|---|---|
| Computer and mathematical occupations | 1,890 | 1,976 | 1,628 | -18% |
| Computer systems analysts | 1,701 | 1,894 | 1,487 | -21% |
| Computer programmers | 1,889 | 1,906 | 1,760 | -8% |
| Software developers | 2,283 | 2,296 | 2,020 | -12% |
| Computer support specialists | 1,424 | 1,478 | 1,348 | -9% |
| Computer occupations, all other | 1,597 | 1,631 | 1,430 | -12% |
| Operations research analysts | 1,917 | 2,208 | 1,665 | -25% |
| Other mathematical science occupations | 1,595 | 1,668 | 1,474 | -12% |
(Source: AIPRM via BLS)
As of 2023, the smallest gender pay gap in tech jobs is seen for computer programmers, where men generally earn 8% more per week than women. The typical female computer programmer in the US can expect to earn $1,760 per week compared to $1,906 for a typical male.
US women can expect to earn the most when employed as software developers, with a median salary of $2,020 per week. Yet, this is around 12% less than their male counterparts employed in this role.
World’s wealthiest women in tech vs. men #
Zhou Qunfei is the highest-ranked female in Forbes’ list of the richest people in technology for 2024. Sitting in 26th position, Hong Kong’s Qunfei has an estimated net worth of $10 billion – almost twice as much as her national counterpart Lam Wai Ying in 47th position (the second-highest ranked female in the top 100). Both have made their fortunes in the smartphone screen industry.
Statistics on the wealthiest women in tech #
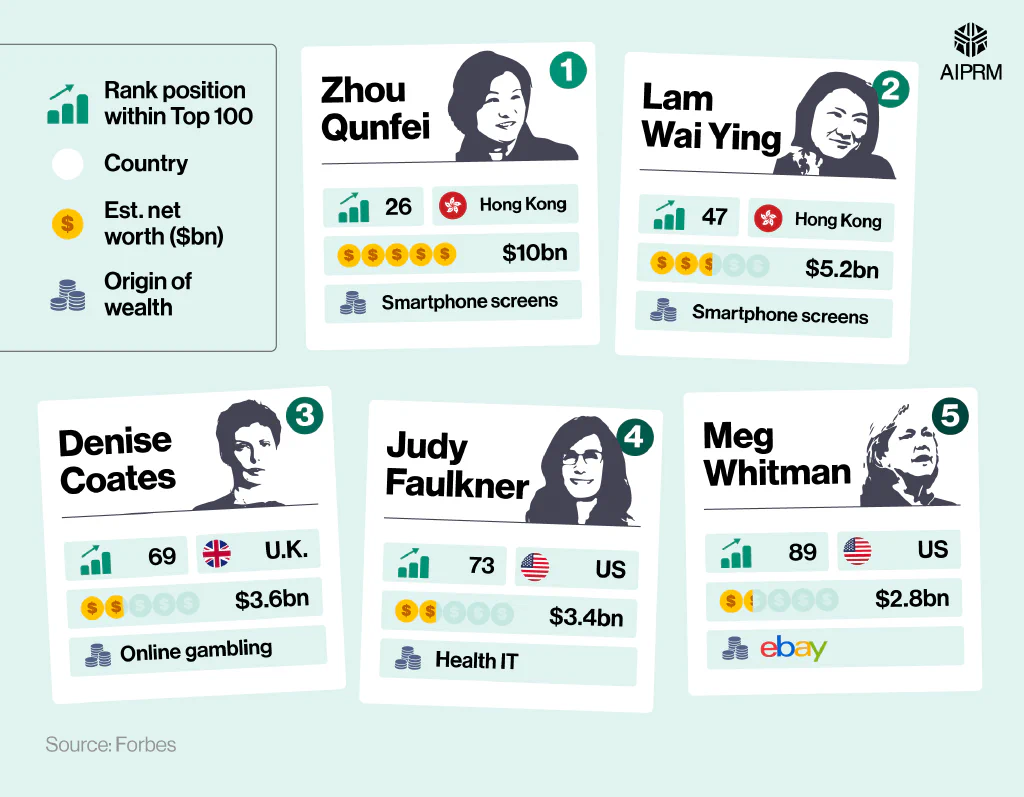
Denise Coates, in 69th place, is the highest-positioned female from the UK on the Forbes Rich List in Tech. With an estimated wealth of $3.6 billion, this puts her marginally ahead of America’s wealthiest woman in tech for 2024, Judy Faulkner (73rd).
Statistics on the wealthiest men in tech #
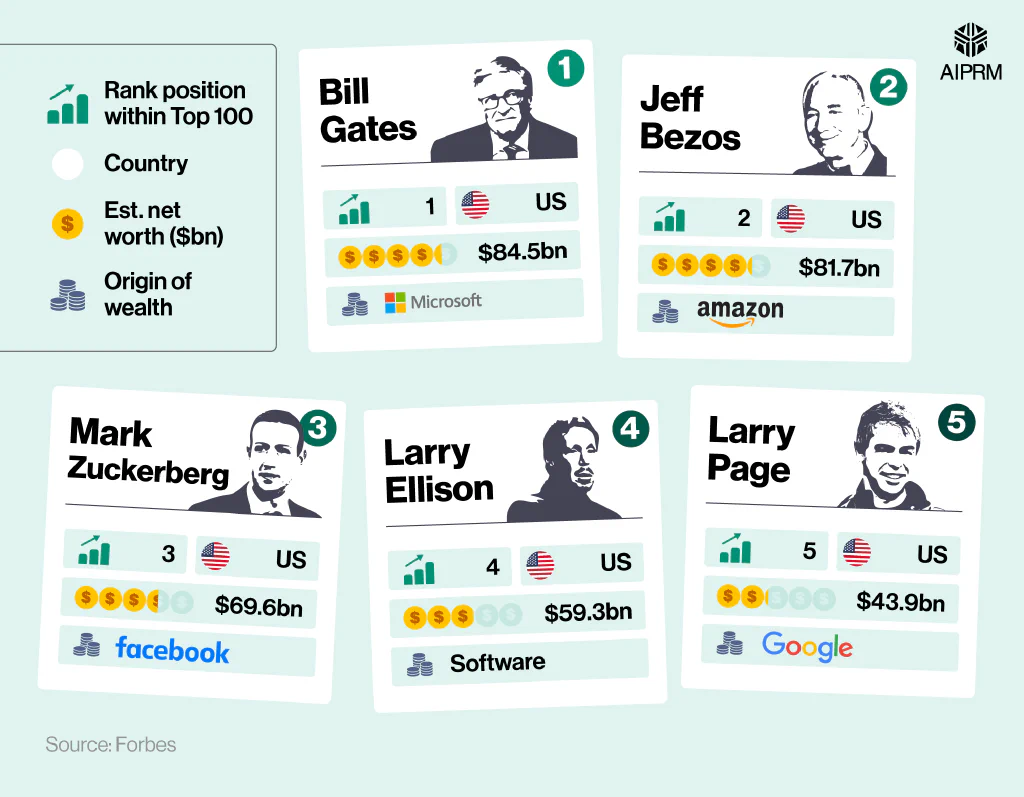
Bill Gates is the wealthiest man in tech for 2024, according to Forbes. With an estimated net worth of $84.5 billion, the Microsoft tycoon earns around 8.5 times more than Zhou Qunfei in 26th – the world’s wealthiest woman in tech for 2024.
In fact, the combined wealth of the five richest women in tech for 2024 totals $25 billion – less than a third of Gates’s estimated wealth.
Most influential women in tech #
As of 2024, Mary Barra had the most social media followers of all women in tech, with a combined following of almost 1.49 million across LinkedIn and X. This was over twice the number of social media followers compared to Clara Shih in second position.
More than 95% of Mary Barra’s followers were via her LinkedIn profile, making her the most dominant female in tech across this platform for the year.
Women in tech with the most social media followers (2024) #
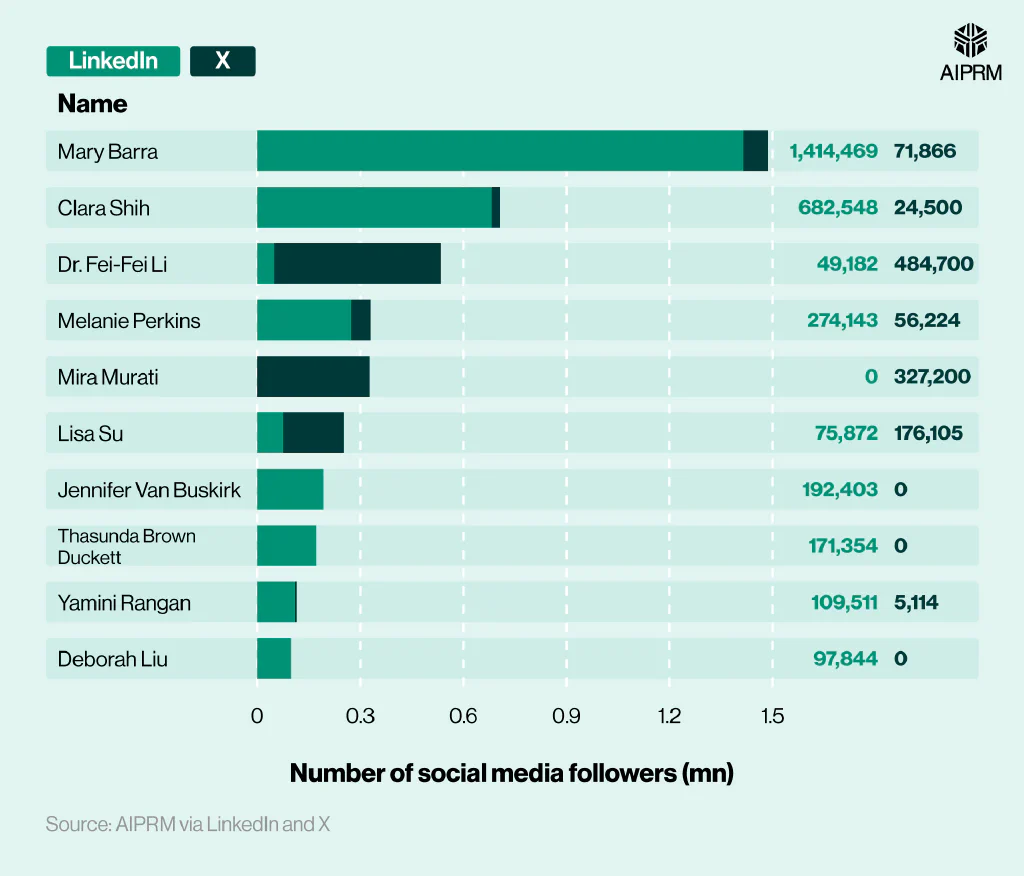
Dr Fei-Fei Li (in third) had the most followers on X in 2024 of the 10 most influential women in tech for the year. With 533,882 followers across both social media platforms, more than 90% could be attributed to her X profile – almost seven times more than Mary Barra’s following on X. That said, Dr Li’s combined number of followers is nearly three times less compared to Mary Barra.
Tech industry employment statistics and what this means for women in 2025 and beyond #
As of 2024, an estimated 9.9 million people were projected to be employed in the US tech industry.
Tech industry employment statistics in the US by component #
| Category | Projected number of employees in the US (mn) (2024) |
|---|---|
| Technology professionals across the economy (inc. the tech sector) (e.g., software developers, network architects, database admins, etc.) | 6.04 |
| Tech sector employment, less technology professionals (e.g., sales, marketing, finance, HR, etc.) | 3.86 |
| Total | 9.9 |
(Source: CompTIA)
Approximately three-fifths (61%) of these jobs were tech professionals across the economy, such as software developers, network architects, and database admins.
The remaining two-fifths (39%) were still employed in the tech sector but in less technology-based roles (e.g., sales, marketing, finance, and HR).
Top projected growth occupations for tech-related jobs in the US (2024-34) #
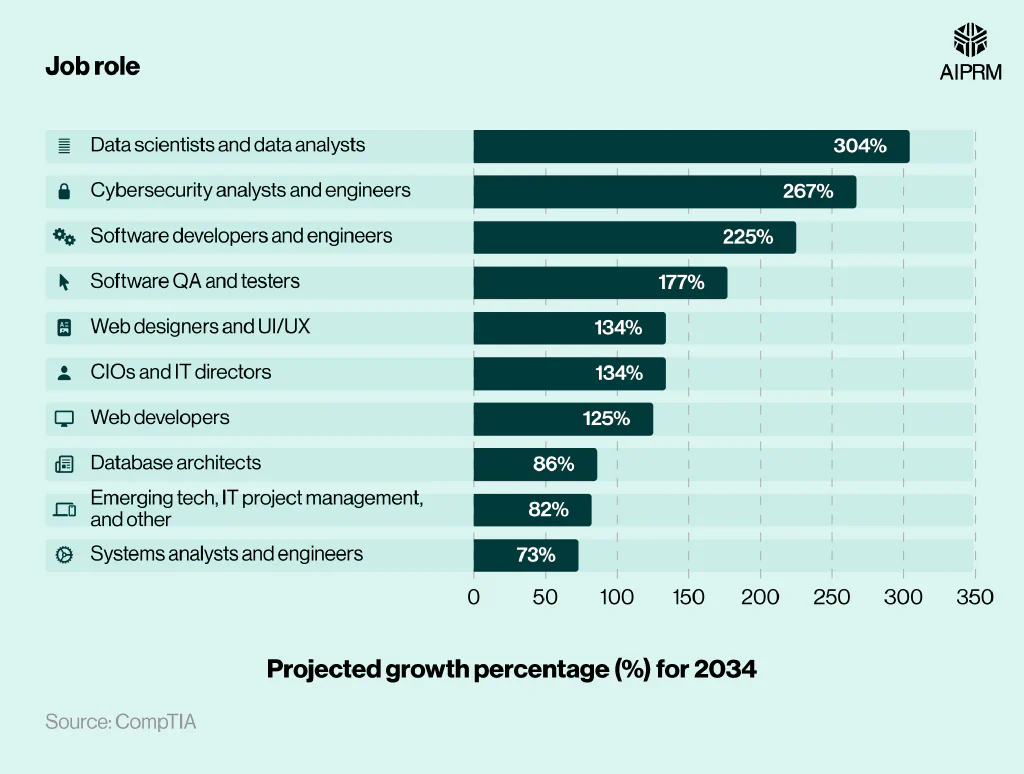
Data scientists and data analysts are expected to see the biggest percentage growth in jobs in the US, with over three times more people working in this role by 2034 (+304%).
This is followed by cybersecurity analysts and engineers, who could see an increase of 27% in the number of jobs across the US by 2034, as well as software developers and engineers (+225%).
This would offer more opportunities for women to enter the tech industry, provided they have the confidence, skills, and qualifications to apply for these positions and get them.
US tech industry employment statistics #
| Statement | Percentage (%) |
|---|---|
| Projected net new workers added in 2024 | 300,394 (+3.1) |
| Proportion of new tech jobs in the IT services and custom software services sectors since 2018 | 50% |
| Percentage contribution of the tech sector to the economy (2023) | 8.9% ($2.04 trillion) |
| Projected replacement rate for tech jobs (2024-34) | 6% (approx. 350,000 workers annually) |
| Projected turnover rate for tech jobs (2024-34) | 36% |
| Median wage (2022) | $104,556 |
| Median tech wage (2022) compared to median national wage | +130% |
(Source: CompTIA)
Data from CompTIA suggests that the tech workforce grew by 3.1% between 2023 and 2024, resulting in a net growth of 300,394 new employees in the sector. Half (50%) of the growth between 2018-24 was in the IT services and customer software service categories.
It’s also estimated that the tech sector contributed around 8.9% to the US economy in 2023, to the tune of $2.04 trillion. This highlights the significance of the industry on a national scale economically.
As companies look to develop and become more efficient, one of the primary concerns in the tech industry is the replacement of jobs by AI and other technologies. The projected job replacement rate in the tech industry for 2024-34 is 6% (or roughly 350,000 workers per year).

According to AI replacing jobs statistics, eight out of 10 women in the US (roughly 58.87 million) are currently working in jobs highly exposed to generative AI automation.
While technology will replace some jobs within the tech workplace, these figures indicate that new job openings and employment opportunities will likely be created. Therefore, women looking to work in tech should not be deterred by this; instead, they should view it as an opportunity to learn new skills and seek new employment opportunities.
The median annual wage for US tech workers in 2022 was $104,556 – more than double the typical earnings across all industries for the year. This suggests that those women looking to work in tech could use this as a chance to boost their income and earn more money compared to working in other sectors.
US tech industry demographics #
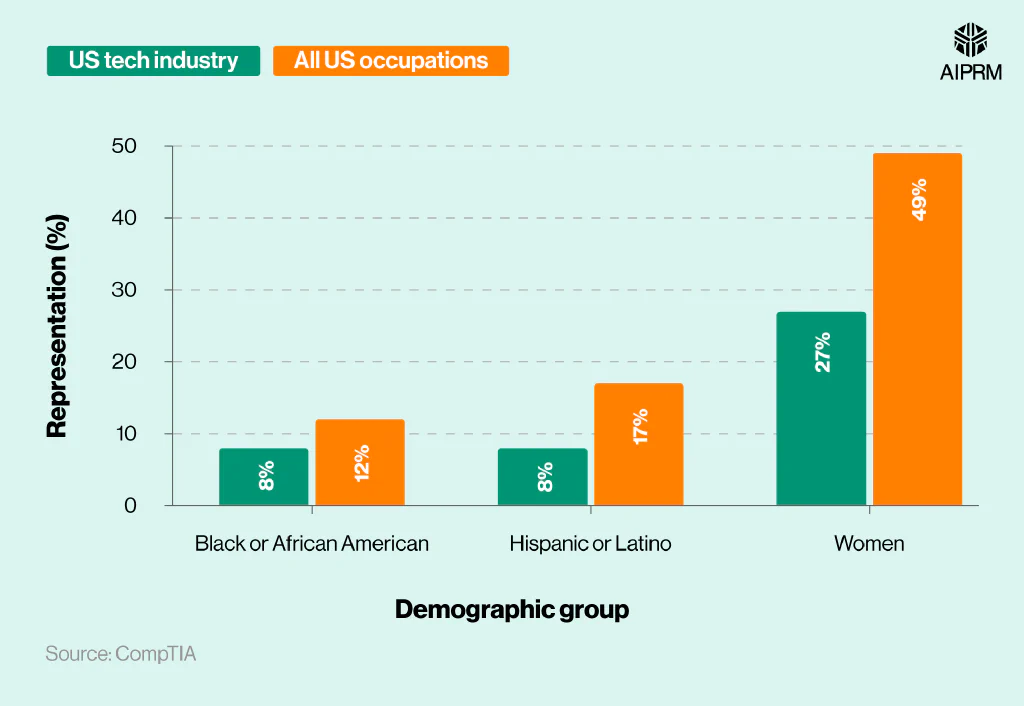
According to CompTIA’s 2024 report, women occupied just over a quarter (27%) of the US tech industry compared to just under half (49%) of all occupations. This suggests that women are significantly underrepresented in the US tech sector employment compared to other jobs across the country.
For context, less than one in 10 people employed in the US tech industry are either Black or African American (8%). The same percentage is true for Hispanic or Latino employees (8%). This indicates that the tech industry as a whole across America is dominated by white males.
Women in tech FAQs #
How many women work in tech?
The number of women working in tech varies depending on which country you’re in, who has compiled the analysis, and when it was produced. For example, CompTIA suggests that approximately a quarter (27%) of the US tech workforce is women, compared to slightly less (23%) from the Womentech Network. This equates to around 3.7 million women working in tech positions across America.
Who was the first woman in technology?
Ada Lovelace is considered the first woman in technology, as the first computer programmer and the founder of scientific computing. Her algorithm was the first designed for a machine to carry out, working with Charles Babbage on his Analytical Engine.
Who are the biggest women in the tech world?
According to Forbes’ list of the World’s Top 50 Women in Tech, Australia’s Manal Al-Sharif comes out on top, followed by Jasmine Anteunis from France and Chantelle Bell from the UK in second and third, respectively.
What is the role of women in technology?
Women play many important roles in technology by providing innovative solutions and fresh perspectives when it comes to problem-solving. This can help fuel gender diversity in the workplace and help reduce the gender gap in tech, encouraging economic growth and increased profitability. Women in leadership positions in the tech industry are helping to drive the development of new technologies through strategic planning and more efficient decision-making processes.
Why we need women in tech
There are many benefits to having more women in tech:
- Diversity can lead to greater innovation: Women make up approximately 50% of the world population, yet only a quarter (27%) of the tech industry workforce. Having a more balanced workforce should bring fresh ideas to the table and generate innovative solutions that help reflect the needs of your customer base.
- Increased revenue: Research suggests that organizations that focus on gender diversity in the workplace outperform their competitors by around 20% in terms of profitability.
- More role models: This should inspire more women to join the tech industry and help narrow the gender gap in tech employment statistics.
- Help close the gender pay gap: Almost a third (32%) of women claim the biggest challenge they face in tech is not earning as much as their male counterparts despite doing a similar role. Narrowing this gap should encourage more females to take the jump into tech occupations and boost their average earnings.
How have women contributed to advancements in science and technology?
Women have made significant contributions to science and technology across multiple fields, including Ada Lovelace (considered the world’s first computer programmer) and Grace Hopper (the developer of computer languages written in English). Marie Curie won two Nobel Prizes for her work on radioactivity and how it applies to medicine, whereas developments courtesy of Anne McLaren in the 1950s led to the birth of the first test-tube baby in 1978.
Sally Ride was the first American female in space in 1983 and is also credited as the founder of NASA’s EarthKam project, whereas Shirley Ann Jackson was instrumental in developing modern telecommunications technology.
What was a consequence of the success of women in high-tech and professional industries?
Successful women in high-tech and professional industries provide role models for younger females looking to enter employment in the technology sector. For example, research by the Anita Borg Institute found that women with mentors in the tech industry were around three-quarters (77%) more likely to be still working in tech after three years compared to those without mentors.
What is the biggest challenge for women in tech?
Women in tech face multiple challenges in the workplace, such as underrepresentation (with only 27% of tech-related jobs held by females). This can result in fewer opportunities for mentoring and the lack of a clear career pathway for progression. Gender bias still exists within the tech workplace when it comes to recruitment, meaning women can often be overlooked for leadership roles in favor of men. Women also tend to earn around 3% less than men on average, leading to a pay disparity in the tech world.
Women in tech glossary #
Gender pay gap in tech #
The difference in pay between men and women who work in the tech industry.
Tech demographics #
A collection of statistics that describes the characteristics of a population – in this case, within the tech industry. This can include various socioeconomic measures such as age, gender, ethnicity, religion, education, and income.
Tech gender gap #
The disparity between men and women in the tech industry. This could include levels of access to technology, representation in the workforce, average pay, gender bias, and stereotypes in the workplace.
Tech startup #
A business that uses technology to create new products or services or develop existing ones. They are usually in the early stages of operation and can be created to provide innovative solutions to a particular issue/problem. Tech startups are characterized by high growth potential and normally focus on a specific type of technology or software product.
TMT women #
An abbreviation for women who work in technology, media, and telecommunications (TMT).
Sources and methodology #
https://startupgenome.com/articles/only-15-percent-of-tech-startup-founders-are-female
https://www.zippia.com/advice/women-in-technology-statistics/
https://www.geo20.com/help-hub/women-in-tech/
https://www.accenture.com/us-en/about/corporate-citizenship/tech-culture-reset
https://www.womenintech.co.uk/women-in-tech-survey-2023/
https://www.womenintech.co.uk/wp-content/uploads/2022/12/Women-in-Tech-Survey-2023.pdf
https://www.fawcettsociety.org.uk/Handlers/Download.ashx?IDMF=1f3cb985-8552-464b-b374-42084def22bb
https://www.deloitte.com/global/en/issues/work/content/women-at-work-global-outlook.html
https://sgff-media.s3.amazonaws.com/sgff_r1eHetbDYb/Women+in+the+Workplace+2023_+Designed+Report.pdf
https://www.womentech.net/en-gb/blog/leadership-promotion-gap-women-in-tech
https://www.womentech.net/women-in-tech-stats
https://eightfold.ai/blog/tech-layoffs-labor-market-talent-management/
https://fortune.com/ranking/global500/
https://www.forbes.com/richest-in-tech/list/
https://obamawhitehouse.archives.gov/women-in-stem
https://www.forbes.com/top-tech-women/list/
https://www.linkedin.com/pulse/role-women-sector-zingmind
https://www.womenintech.co.uk/5-benefits-of-more-women-working-in-tech/
https://www.cio.com/article/201905/women-in-tech-statistics-the-hard-truths-of-an-uphill-battle.html
https://www.careerflow.ai/blog/women-in-tech-challenges
https://www.womenintech.co.uk/the-gender-pay-gap-in-tech-how-do-we-close-it/
https://www.techtarget.com/whatis/definition/customer-demographics
https://www.fawcettsociety.org.uk/system-update-addressing-the-gender-gap-in-tech-report
https://www.techscaler.co.uk/resources/what-is-a-tech-startup
Women in tech across Europe #
AIPRM sought to analyze women’s statistics in technology. For that, data from Eurostat was collected to compare tech industry demographics by location and the pay gap. For the EU countries with missing values, the data was forecasted using linear regression. The percentage difference between 2012 and 2023, as well as between women and men, was calculated to see how female employment changed over time and how it compares to males.
Index study: Top 10 US states for women in tech #
AIPRM looked to analyze women’s statistics in technology by US state. For that, data from the BLS was collected to compare tech industry demographics by location and the gaps in pay and representation.
The index score measures how favourable each state is via the four variables chosen:
- Number of women workers (F column)
- Median weekly earnings for women (G column)
- Women’s earnings as a percentage of men’s (L column)
- Female vs Male percentage change in employment (M column)
Each of these is ranked across all states using Percentrank, where higher rank=better.
The ranks are weighted equally, at 25% each. The combined weighted rank is summed, then the square root of the sum is taken to normalise it (giving more weighting to the top performers).
Finally, the score is rounded and multiplied by 10 to get the 0-10 range."
https://www.bls.gov/cps/cpsaat11.htm
https://www.bls.gov/opub/reports/womens-earnings/2023/home.htm
Gender gap in tech by job level #
AIPRM sought to analyze women’s statistics in technology by job type. For that, BLS data was collected to compare tech industry demographics by job and the gaps in representation.
https://www.bls.gov/cps/cpsaat11.htm
https://www.bls.gov/opub/reports/womens-earnings/2023/home.htm
Gender gap in the tech industry by the success of companies led by women #
This study analyzed how technology companies led by women perform in comparison to other women-led companies. For that, the women-led companies from the Fortune Global 500 ranking were collected, and the score was calculated using the percent rank method to compare the performance of the technology companies to the non-technology companies.
https://fortune.com/ranking/global500/
Gender pay gap in tech statistics #
AIPRM looked to analyze women’s statistics in technology by gender and job type. For that, BLS data was collected to compare tech industry demographics by gender and job, analyzing the differences in pay.
https://www.bls.gov/cps/cpsaat11.htm
https://www.bls.gov/opub/reports/womens-earnings/2023/home.htm
Most influential women in tech #
This study assessed the most influential women in tech by collecting the number of followers on LinkedIn and X of the top 100 women in tech leaders to watch in 2024, as reported by womentech.net. The top 10 most influential women were then compared to the top 10 most influential men in tech to see if there is a gap between the two.