100+ Women in STEM Statistics 2025

For generations, science, technology, engineering, and mathematics (STEM) have formed the bedrock of our societal development. The modern-day is no exception, with the increasing reliance on technology in everyday life making STEM fields arguably more important than ever.
As with many influential sectors, the STEM industry has seen women under-represented in the workplace. Despite efforts to address the balance, the US Department of Labor found that women accounted for just over a quarter (26%) of US STEM employees in a 2024 report.
With much debate surrounding the gender gap in STEM, AIPRM has compiled the latest women in STEM statistics for 2024-25, highlighting the key areas relating to women’s representation in STEM fields, including employment, salary, education, and much more.
Top 10 must-know women in STEM statistics for 2025 #
- Women made up just over a quarter (26%) of US STEM employees in 2022 – up just 1% from 2000.
- There were 12 female-led STEM companies on the Fortune 500 list in 2024 – up from eight (+50%) in 2015.
- One report found that the median annual salary for a woman in STEM is $66,813 per year – around 4% less than the typical man ($69,841).
- Of those who earned a Bachelor’s degree in Computer and Information Sciences, women accounted for just over a fifth (21.3%) of them.
- Women account for 39% of physical science degrees awarded in the US.
- Just over 6% of female STEM employees in the US federal workforce were from a Hispanic or Latina background in 2019.
- Nearly a quarter (23.99%) of people in 2024 believed that encouragement from a young age would help increase the number of women pursuing STEM careers.
- Just under a quarter (24.17%) of women surveyed in 2024 cited a lack of career opportunities as a reason they stopped pursuing a career in STEM.
- Over a fifth (21.34%) of women in 2024 believed that eliminating the gender pay gap would encourage more women to pursue STEM careers.
- General Motors is the highest-earning woman-led STEM company in the world, with an annual revenue of nearly $172 billion in 2023.
How many women are in STEM jobs? #
Recent women in STEM stats from 2024 found that women accounted for over a quarter (26%) of US STEM employees (data relates to figures from 2022).
The underrepresentation of women extends to director positions, with Spencer Stuart reporting that 31% of directors in the tech industry were women in 2024 – this was the same as that reported for the previous year. Additionally, recent technology statistics found that women accounted for less than half of employees at all the traditional ‘Big Five’ tech firms (Apple, Google, Amazon, Meta, and Microsoft) in 2023.
The story is similar in the UK, where 26% of the STEM workforce was said to be made up of women in the year 2022-2023, up 2% from 2019 and accounting for over 1.1 million jobs. Despite the increases, the current growth rate for women in STEM would mean that equal representation would not be achieved until 2070.
Additionally, data from Women into Science and Engineering (WISE) found that, as of September 2023, approximately 1.3 million (1,310,300) women were working in STEM roles in the UK. This data showed that, by this point in the year, women made up 25.2% of the UK STEM workforce.

Percentage of women in STEM by year #
Women in STEM statistics show that the percentage of US women in STEM jobs more than tripled between 1970 and 2022. Less than a tenth (7%) of STEM workers in the US were women in 1970, with this figure doubling a decade later to 14% in 1980.
The percentage of female STEM workers in the US by year, 1970-2022 #
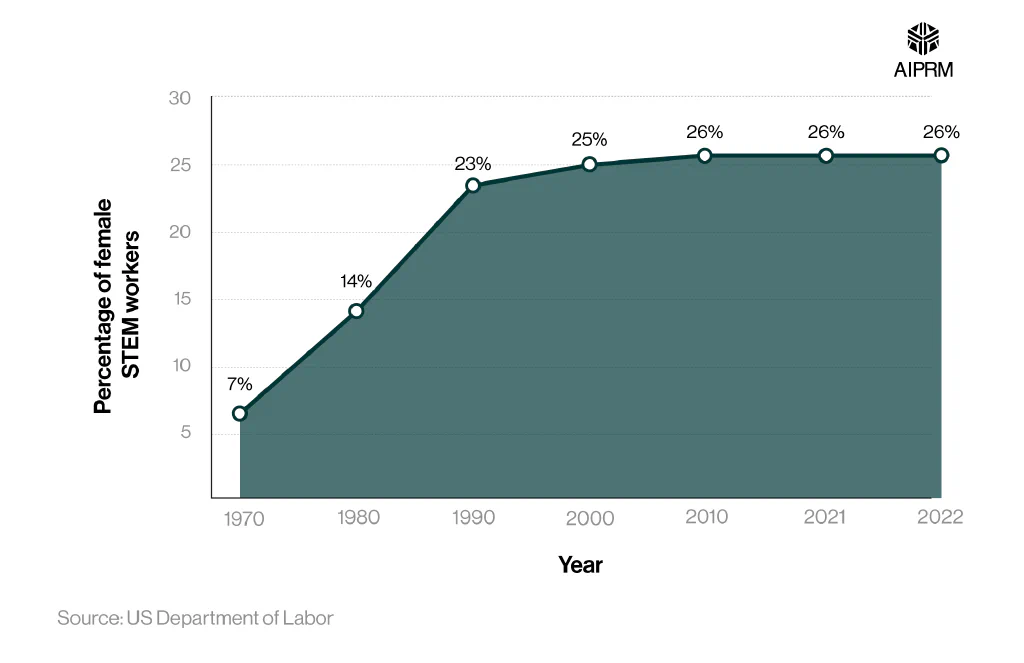
A 9% increase would see female representation rise above a fifth (23%) in 1990, with a 2% climb taking this figure to a quarter (25%) by 2000.
Since 2000, the growth in female STEM representation has stagnated, rising 1% in 2010 (26%) before remaining unchanged in the following 12 years.
Women in engineering statistics #
Less than a fifth (15%) of engineers in the US were women in 2022 – significantly lower than the percentage of women working across the entire STEM industry (26%). Despite the low representation, the percentage of female engineers has climbed significantly since 1970, when the figure stood at just 3%.
The percentage of women engineers in the US by year, 1970-2022 #
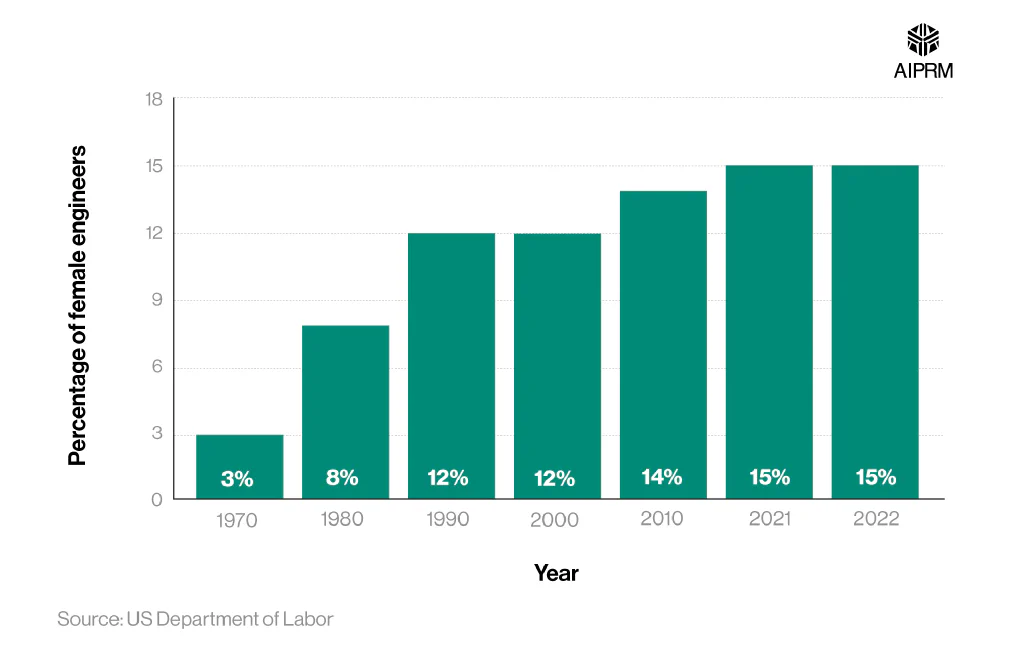
The percentage of women engineers more than doubled between 1970 and 1980 to just under a tenth (8%). By 1990, this figure exceeded 10% for the first time, reaching 12%.
Growth slowed after 1990, rising just 2% in the two decades to 2010 (14%) and a further 1% by 2021 (15%). The latest figures mean that the percentage of female engineers is five times greater in 2022 than in 1970.
What percentage of computer occupations are taken by women? #
Less than a quarter (24%) of US computer jobs were held by women in 2022. This was unchanged from the previous year, meaning female representation in computer jobs is 2% lower than the percentage of women across all STEM occupations (26%).
The percentage of women in computer occupations in the US, 1970-2022 #
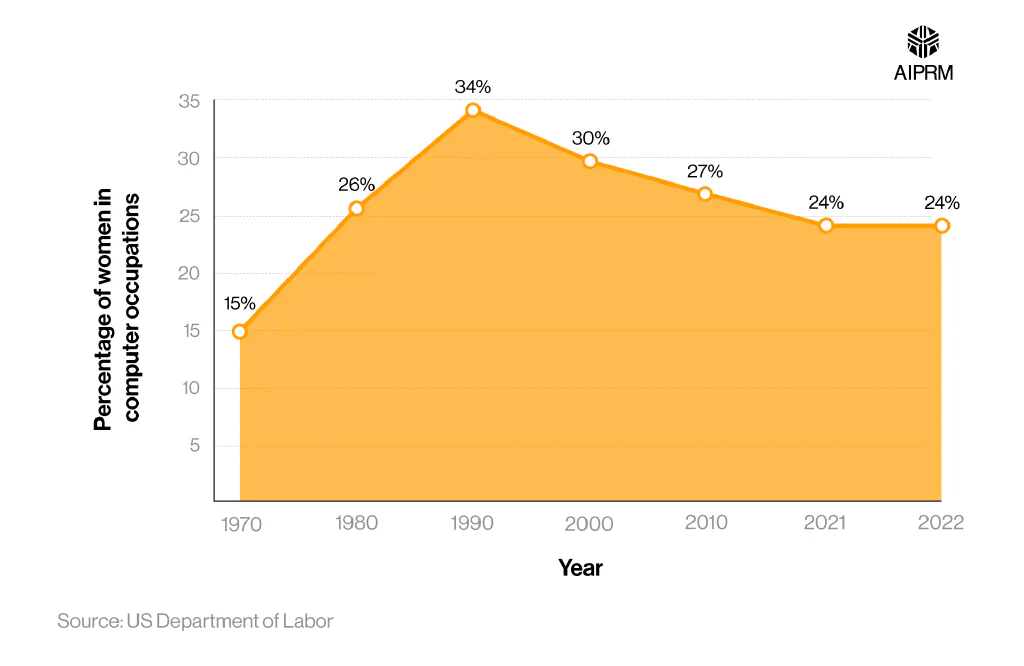
The percentage of women in computer occupations has fluctuated since 1970, when the figure stood at less than a fifth (15%). An 11% rise took the total past a quarter (26%) in 1980 and exceeded a third (34%) by 1990.
From here, numbers have slowly declined, with consecutive falls in 2000 and 2010. The 3% decrease between 2010 and 2021 meant that female representation sat below a quarter (24%) for the first time since before 1980.
The latest figure for 2022 means that the percentage of women in STEM is 9% higher in 2022 than in 1970.
What percentage of women are in mathematical occupations? #
Over two-fifths (44%) of mathematical jobs were taken by women in 2022 – 18% more than the overall percentage of women in STEM (26%). The percentage of women working in maths has accelerated since 1970 when the figure stood at less than a fifth (15%).
The biggest decade growth was between 1970 and 1980, when the percentage of women in maths more than doubled, reaching 36% (+21%).
The percentage of US women in mathematical occupations, 1970-2022 #
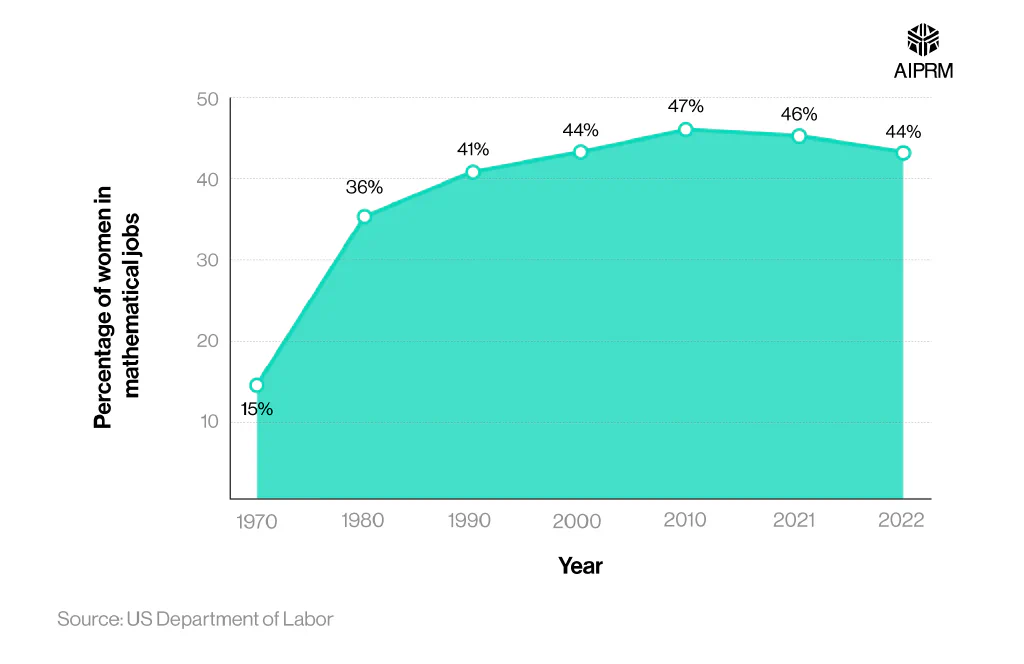
A 5% rise saw female representation surpass 40% for the first time in 1990, with the figure reaching 47% by 2010. After that, numbers began to fall, with a 1% drop in 2021 (46%) followed by a 2% fall the following year (44%).
The latest figure of 44% means that the percentage of women in mathematical jobs nearly tripled between 1970 and 2022.
The percentage of women in science occupations #
The latest women in STEM statistics show that women accounted for over two-fifths (44%) of US life and physical science jobs in 2022 – down 1% from the previous year but 18% more than the wider STEM industry (26%).
The percentage of women in science has steadily risen since 1970, when the figure stood at 14%. Two decades later, in 1990, the percentage of women in these roles had almost doubled to 27%.
The percentage of US women in life and physical science occupations, 1970-2022 #
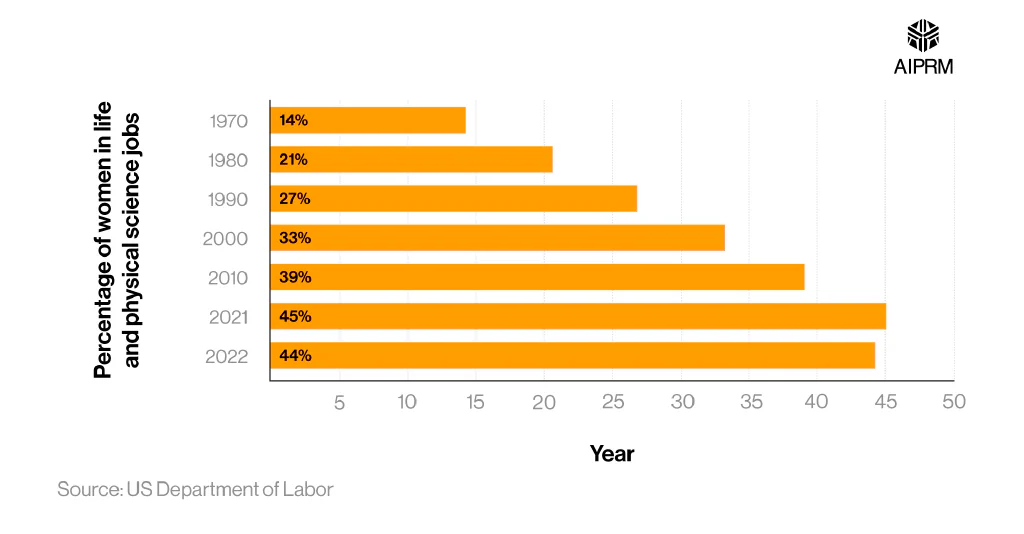
Further growth between 1990 and 2000 saw female representation rise to a third (33%) for the first time, before increasing to 39% in 2010.
In 2021, the figure reached an all-time high, with over four in 10 science jobs being held by women (45%). However, this number fell slightly the following year to 44%.
The latest figure for 2022 means that the percentage of women in science more than tripled over the previous five decades.
Percentage of women in social science occupations #
Social science had the highest percentage of female representation of any STEM occupation covered in the US Department of Labor’s study, at 61% in 2022. This was more than double the total for the entire STEM industry (26%) and the only occupation where women outnumbered men.
The percentage of US women in social science occupations, 1970-2022 #
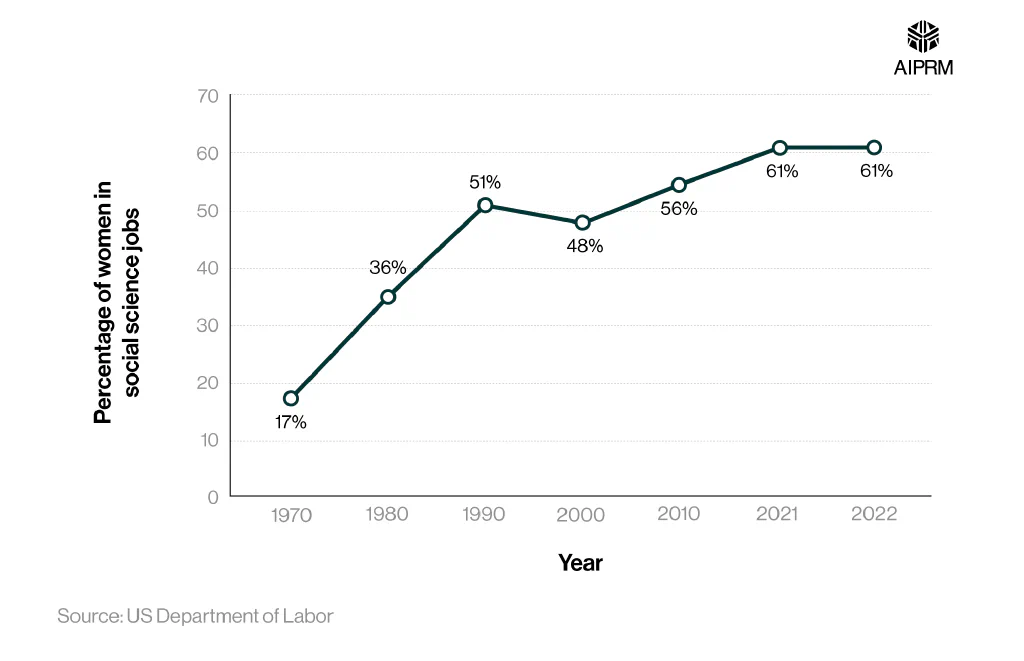
The number of women in social science roles has accelerated since 1970, when it stood at less than a fifth (17%). The biggest percentage increase occurred between 1970 and 1980 (+19%), with a further 15% rise in 1990 taking the number past half (51%) for the first time.
A 3% fall in 2000 (48%) was followed by an 8% increase a decade later (56%), with this number rising past three-fifths (61%) in 2021. The latest figure means that the percentage of women in social science jobs more than tripled between 1970 and 2022.
How does US STEM employment for women compare with the rest of the world? #
A report from the Massachusetts Institute of Technology (MIT) found that just under a quarter (24%) of US STEM employees were women in 2023. This was 7% more than the European Union (17%) and 8% more than Japan (16%).
It’s worth noting that the US figure from the Massachusetts Institute of Technology is 2% lower than the figure reported by the US Department of Labor in 2022, suggesting the difference between the countries and regions may be even higher.
The percentage of women working in the STEM industry by global region, 2023 #
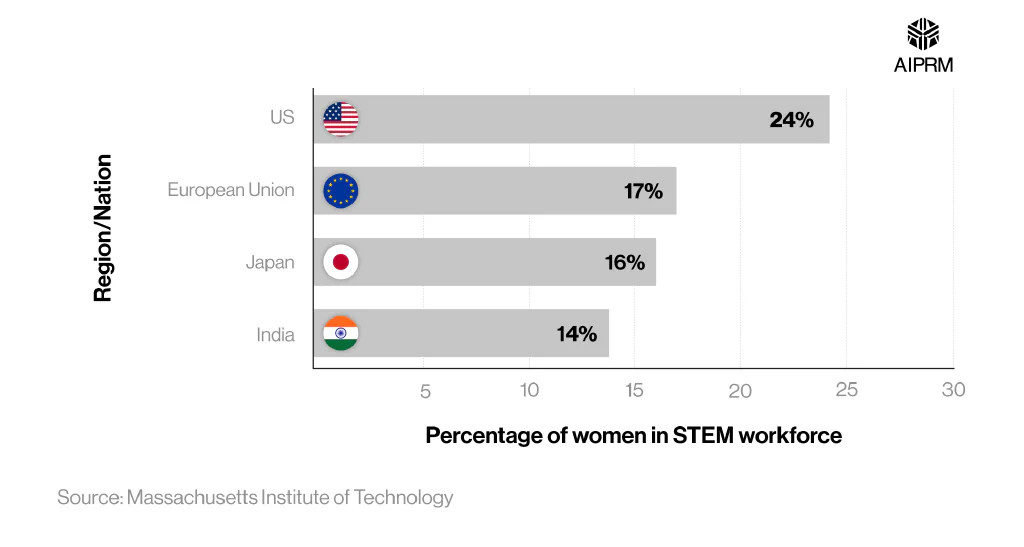
India had the lowest percentage of female STEM employment in the study, at 14% – 10% less than the US and 3% lower than the European Union.
Which European countries have the highest percentage of women in STEM? #
Around seven in 10 (71.4%) working women in Iceland were employed in the technology and science industries in 2023 – over 20% more than the percentage of working men (49.2%). This was 0.6% higher than any other European country, with Sweden the only other to exceed 70% (70.8%).
The European countries with the highest proportion of female workers in the science and technology sector, 2023 #
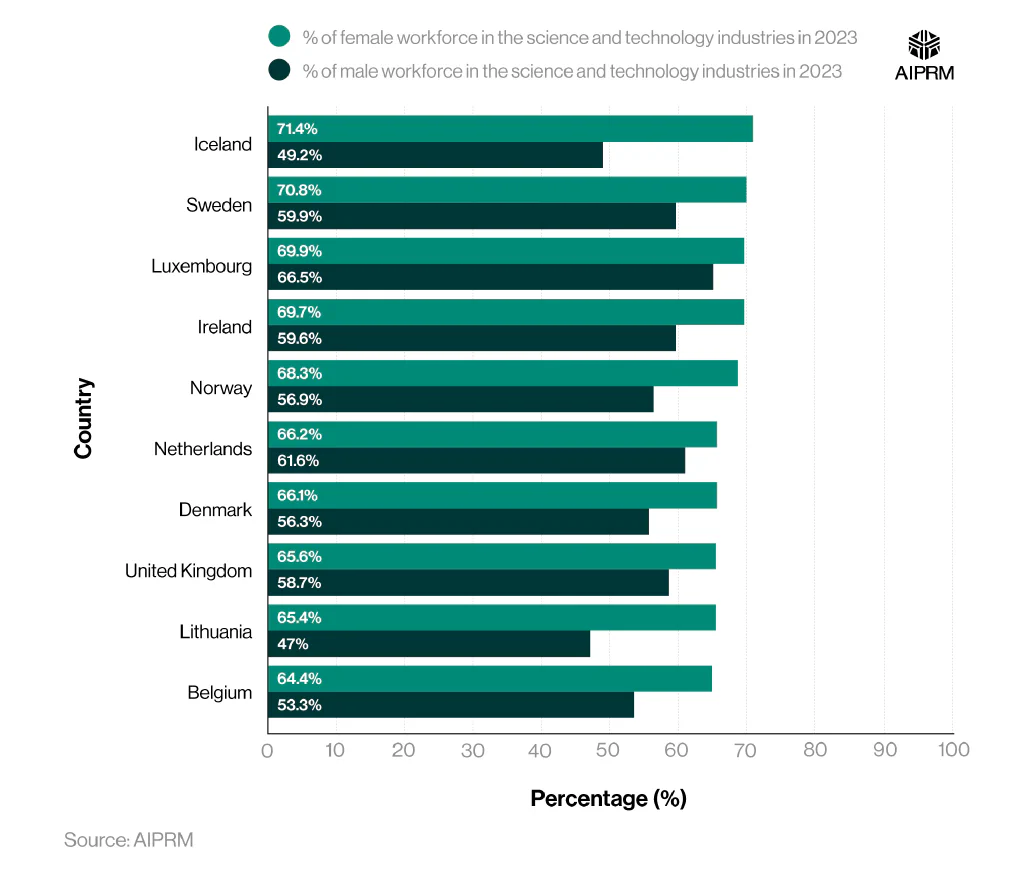
There are three other European countries where over two-thirds of working women are employed in either science or technology. They are:
- Luxembourg (69.9%)
- Ireland (69.7%)
- Norway (68.3%)
Just under 66% (65.6%) of female workers in the UK belonged to science and technology professions – nearly 6% lower than in Iceland. This was narrowly more than Lithuania (65.4%) and Belgium (64.4%), which had the ninth and tenth highest percentages, respectively.
Lithuania had the lowest percentage of working men in science and technology jobs out of all the top 10 countries, with less than half (47%) working in these fields.
Which European countries have the lowest percentage of women in STEM? #
Less than two-fifths (39.4%) of working women in Romania are employed in science and technology jobs – the lowest total of any European country. However, this number is substantially higher than the percentage of Romanian men working in science and technology, which stood at just over a fifth (22.9%).
The European countries with the lowest proportion of female workers in the science and technology sector, 2023 #
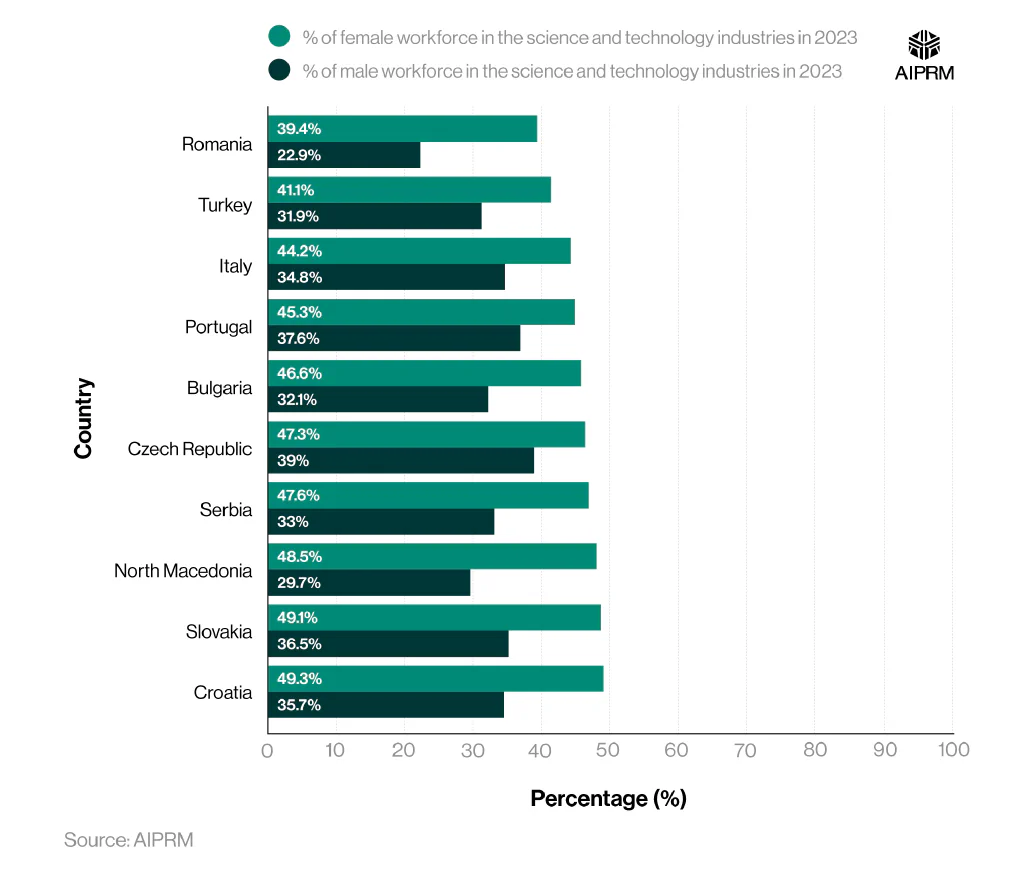
Just over two-fifths (41.1%) of women working in Turkey were employed in either science or technology– nearly 10% more than the number of men (31.9%). Italy’s total of 44.2% was the third lowest total, making it the final country in the study where less than 45% of working women were employed in science and technology.
Eighth-placed North Macedonia had around half (48.5%) of its female workers in science and technology roles – 7.4% more than second-placed Turkey. However, North Macedonia’s male employment rate of 29.7% was 2.2% lower than Turkey and the second-lowest in the top 10.
The gender gap in STEM statistics #
Recent statistics on women in STEM show that while around 70% of global healthcare workers are women, they account for just a quarter (25%) of leadership roles.
The disparity in STEM extends to education, with less than two-fifths (38%) of women who majored in computer science subjects working in the same field, compared to 53% of men.
The gender pay gap in STEM statistics #
Median annual salary for men vs. women in STEM #
The latest women in STEM statistics from 2024 showed that the median annual salary for a female STEM worker stood at just under $67,000 in 2021. This was over half (52%) more than the median wage for women across non-STEM occupations ($43,971).
The median annual salary of STEM and non-STEM workers by gender (2024 report) #
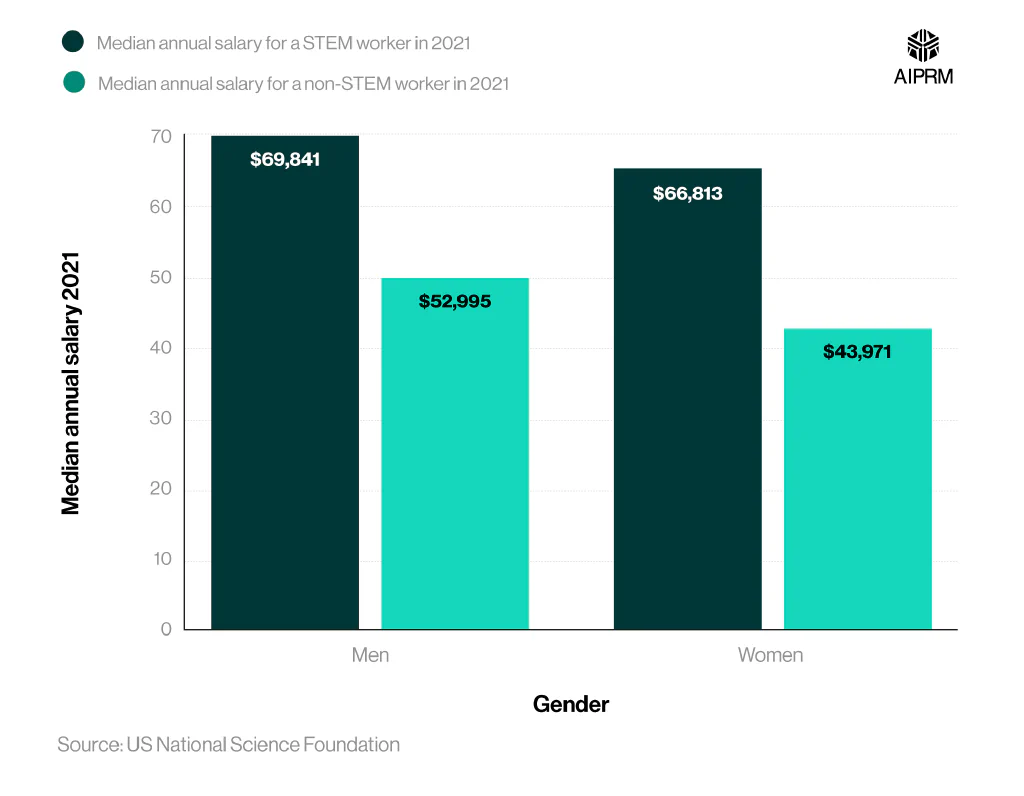
Though women in STEM tend to earn more than non-STEM professionals, their salaries remain lower than their male counterparts. The typical male STEM worker earns just under $70,000 per year – around a third (32%) more than the median salary for men across non-STEM industries ($52,995).
This means the median annual salary for women in STEM is around 4% less than that for men in STEM.
Median salary for STEM workers by gender and job type #
Analysis of women in STEM statistics shows that the gender pay gap exists throughout various levels of STEM occupations. The median annual salary for female scientists or engineers was $79,696 – nearly a fifth (18%) less than the median salary for a man ($96,941).
The median annual salary of STEM workers by gender and occupation (2024 report) #
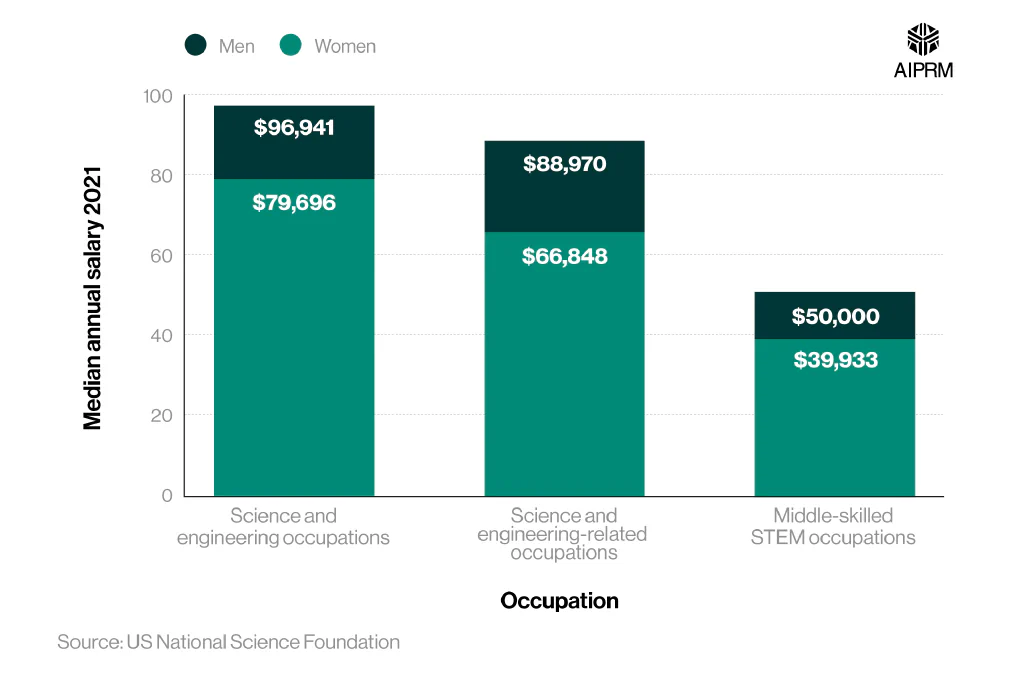
For jobs related to science and engineering, the median annual salary for women stood at just under $67,000. This was around a quarter (25%) less than the typical man, who was paid nearly $89,000.
The typical salary for women in middle-skilled STEM roles was just below $40,000 – around a fifth (20%) less than men at the same level.
Discover key insights and the latest statistics on AI’s impact in the workplace.
Minority women in STEM statistics #
A 2021 report from the UK Office of National Statistics (ONS) found that just 8% of the UK STEM workforce came from Black, Asian, and Minority Ethnic (BAME) backgrounds in 2021. Of these, the percentage of Black women in STEM was just 0.3%, despite making up 4% of the overall population.
The lack of representation continued in senior roles, with BAME women making up around 2% of board members and senior executives within major UK tech firms.
Number of STEM employees by race and gender #
White women vastly outnumber women from other backgrounds in terms of STEM employees in the US federal workforce. A 2019 study from the Equal Employment Opportunity Commission found that white women made up roughly two-thirds (66.02%) of female STEM employment, despite making up under 60% of the total US female population in 2021.
It’s worth noting that these figures may have changed in recent years, in line with the changes seen with female employment across the STEM industry.
The proportion of female STEM employees in the US federal workforce by race, 2019 #
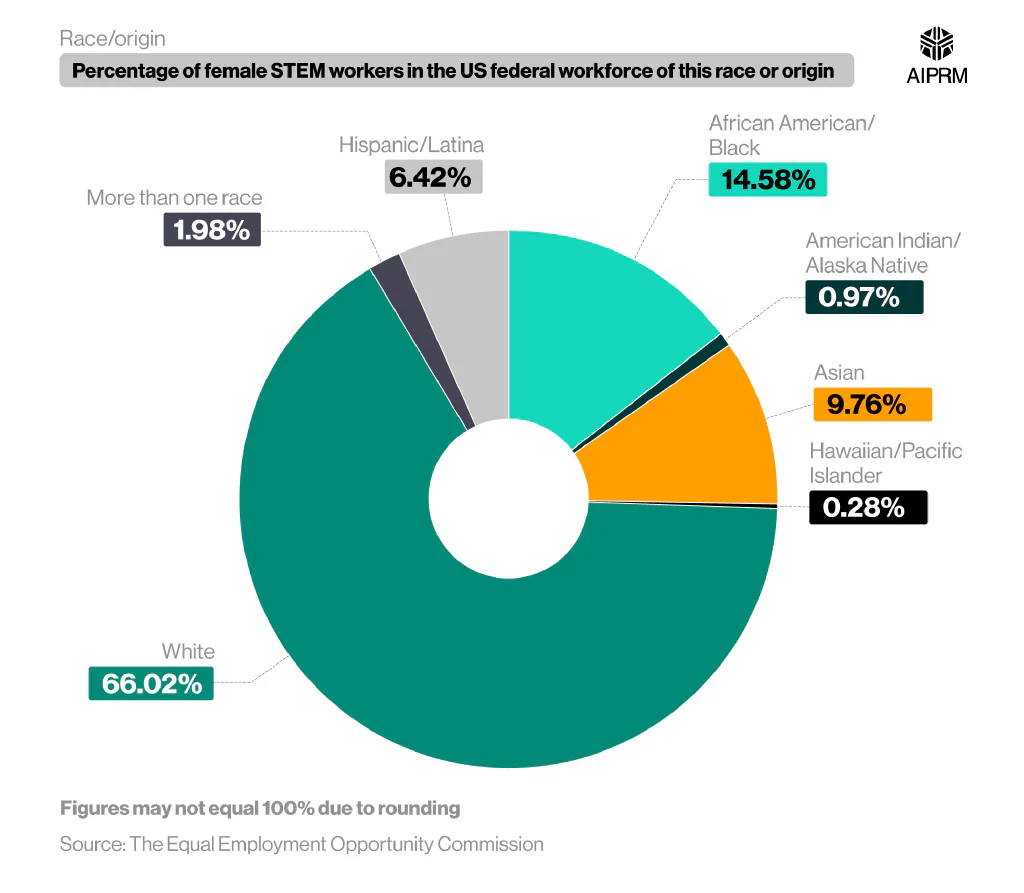
Black or African American women had the next highest proportion of female STEM employees in the federal workforce, at nearly 15%. Despite being over four times less than the number of white women, this figure was slightly higher than the proportion of Black women in the US female population (13.9%).
Just under a tenth (9.76%) of female STEM employees in the US federal workforce were Asian – around 5% less than the proportion of Black women (14.58%). Nevertheless, this number was over 3% higher than the overall percentage of US women from an Asian background (6.3%).
Hispanic and Latina women were the most under-represented in terms of population, with just over 6% of female STEM workers in federal departments from these backgrounds – less than half the number of Black or African American workers. This is despite the fact that Hispanics and Latinas account for nearly a fifth (18.5%) of the US female population – 4.6% more than Black or African American women.
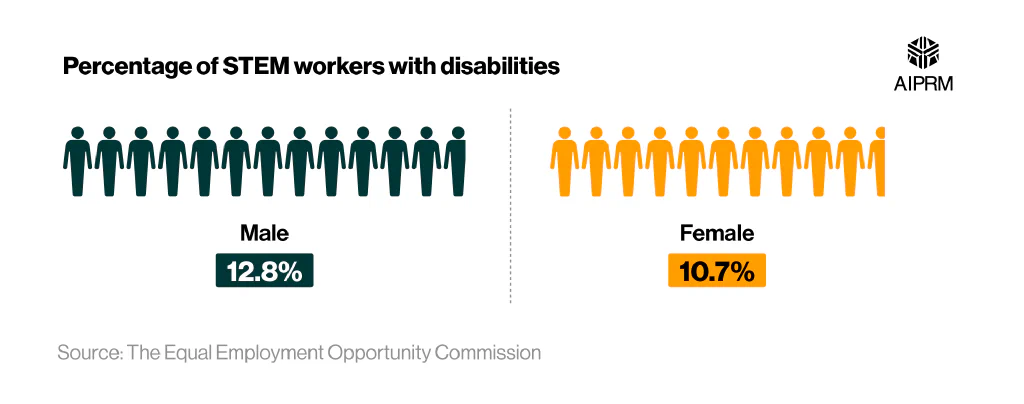
Number of women with disabilities in STEM jobs #
Women with disabilities made up just over a tenth (10.7%) of female STEM employees in a 2019 US federal workforce report. By comparison, disabled men accounted for over an eighth (12.8%) of the male STEM workforce – over 2% (2.1%) more than the percentage of disabled women.
The number of STEM employees with disabilities in the US federal workforce, by gender (2019) #
Women in STEM education statistics #
A 2024 report from the Women Tech Network found that women are under-represented in numerous prominent STEM degree subjects. Of the four subjects covered, Physical Sciences had the highest female representation, at nearly two-fifths (39%).
Just over a third (35%) of Economics degrees were earned by women, making this the only other subject with female representation above 30%.
The percentage of Bachelor’s degrees earned by women #
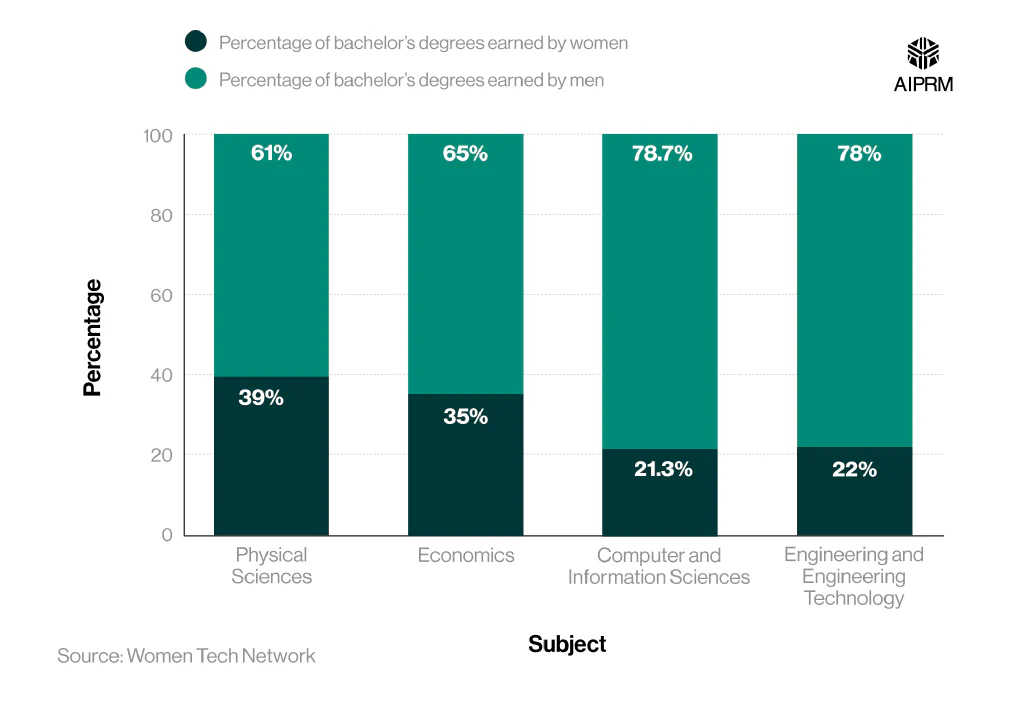
At the other end of the scale, women accounted for just over a fifth (21.3%) of degrees in Computer and Information Sciences – fractionally less than the number for Engineering and Engineering Technology (22%).
How many UK women pursue higher education in STEM fields? #
Nearly a third (31%) of core STEM students in higher education in the UK were women or non-binary people between 2022 and 2023. When broken down by subject, Physical Sciences had the highest percentage of female and non-binary enrollments, at 44% – 13% more than the collective total.
The percentage of UK higher education enrollments by STEM degree subject and gender, 2022-23 #
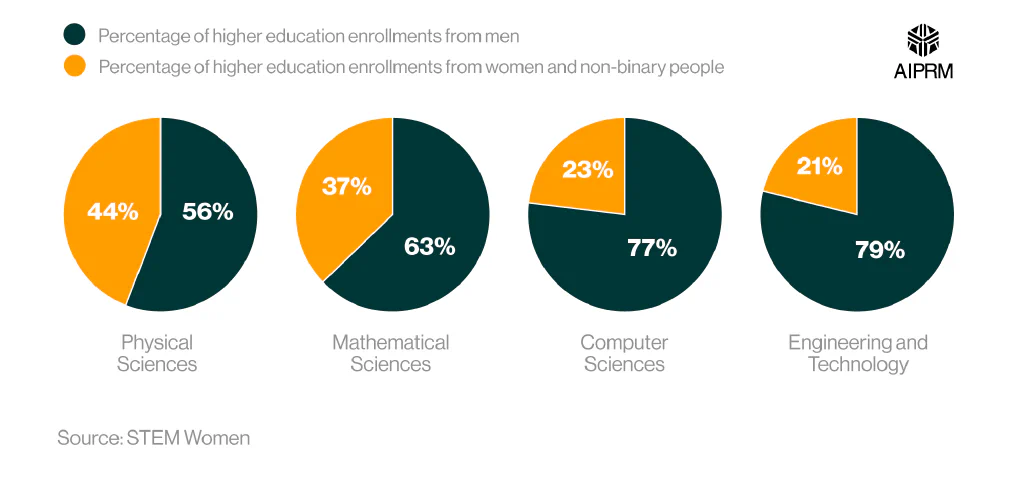
Over a third (37%) of degree enrollments in Mathematical Sciences were from women and non-binary people, making this the only other STEM field with more than 30% coming from these groups. This was 14% more than the proportion of women and non-binary people studying Computer Sciences (23%).
Engineering and Technology had the lowest percentage of non-male enrollments at just over a fifth (21%). This was less than half the total for Physical Sciences and 16% lower than Mathematical Sciences.
Learn more about the growing influence of artificial intelligence in our comprehensive AI statistics and generative AI statistics pages.
Women in STEM business leader statistics #
What are the biggest female-led STEM companies worldwide? #
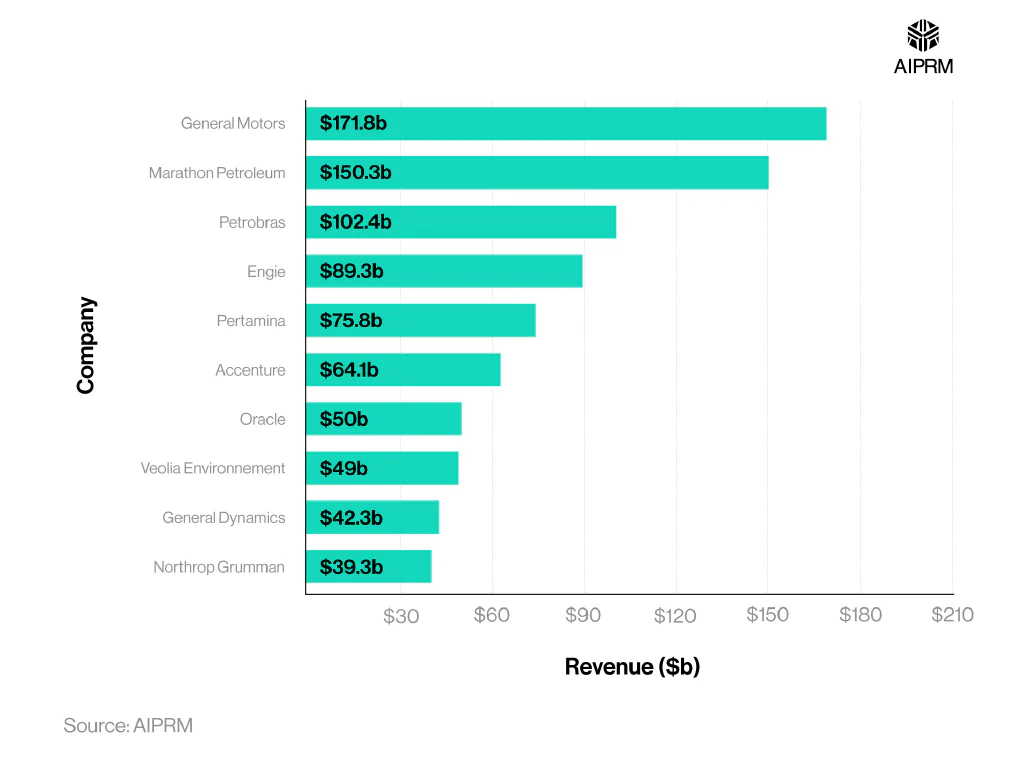
The latest women in STEM statistics show that General Motors is the highest-earning woman-led STEM company in the world. The automotive company generated nearly $172 billion in revenue in 2023 – around 14% more than any other female-led STEM business and the 39th highest of all companies worldwide.
The annual revenue of the highest-ranked female-led STEM companies in the Fortune 500 (2024) #
| Company | Overall rank in the Fortune 500 | Total consecutive years on the Fortune 500 list | Revenue | Profit | Percentage change in profits from 2022 |
|---|---|---|---|---|---|
| General Motors | 39 | 30 | $171.8b | $10.1b | 1.9% |
| Marathon Petroleum | 50 | 13 | $150.3b | $9.7b | -33.3% |
| Petrobras | 99 | 30 | $102.4b | $24.9b | -32.1% |
| Engie | 130 | 29 | $89.3b | $2.4b | 950.7% |
| Pertamina | 165 | 11 | $75.8b | $4.4b | 16.7% |
| Accenture | 211 | 23 | $64.1b | $6.9b | -0.1% |
| Oracle | 299 | 18 | $50b | $8.5b | 26.6% |
| Veolia Environnement | 308 | 22 | $49b | $1b | 34.6% |
| General Dynamics | 362 | 24 | $42.3b | $3.3b | -2.2% |
| Northrop Grumman | 382 | 25 | $39.3b | $2.1b | -58% |
(Source: AIPRM)
Marathon Petroleum had the next-highest revenue at just over $150 billion. This was nearly half (47%) more than any other female-led STEM company and the 50th highest in the overall Fortune 500.
Marathon Petroleum was followed by another crude oil-based company, with Petrobras generating revenue of $102.4 billion in 2023. This was the 99th highest total in the Fortune 500 and made the Brazilian company the final female-led STEM brand with revenue exceeding $100 billion.
Though Petrobras’s revenue was around two-fifths (40%) lower than General Motors’, its overall profits of $24.9 billion was more than the combined total for General Motors ($10.1 billion) and Marathon Petroleum ($9.7 billion).
Rounding off the top five were Engie and Pertamina, with revenues of $89.3 billion and $75.8 billion, respectively.
What are the biggest male-led STEM companies worldwide? #
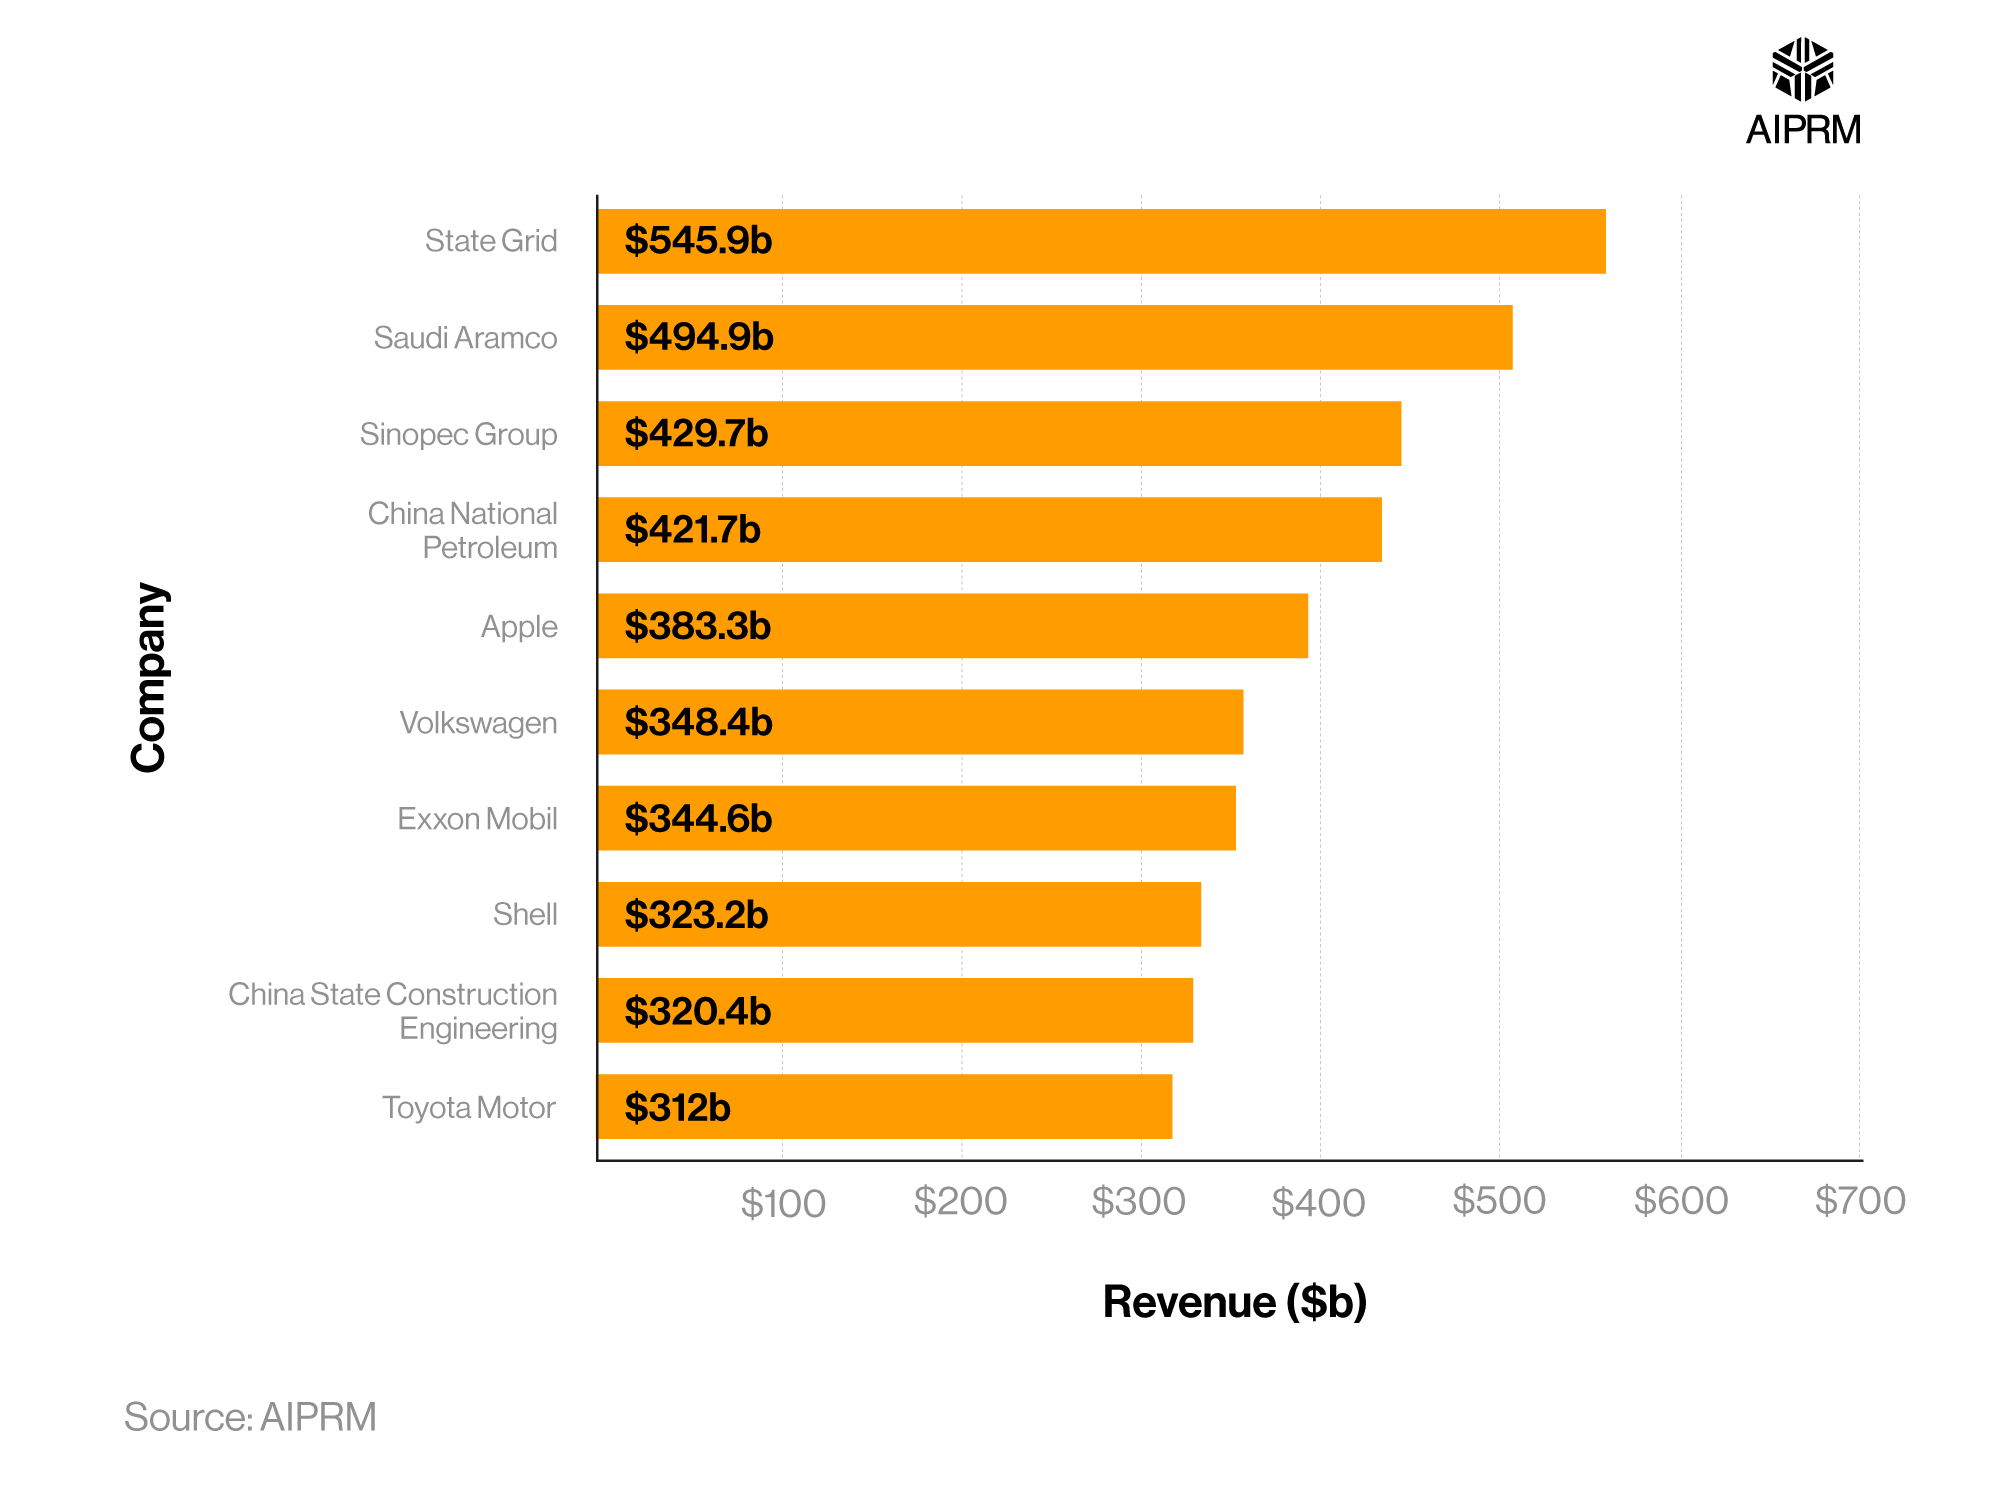
State Grid is the biggest male-led STEM company worldwide, with an overall revenue of $545.9 billion in 2023. This was around a tenth (10%) more than any other STEM company and the third-highest total of any business in the Fortune 500.
Saudi Aramco had the next highest revenue, at $494.9 billion – around 15% more than any other STEM company. Despite generating $51 billion less revenue than State Grid, Saudi Aramco’s total annual profit of $120.7 billion was over 13 times more than the Chinese utility company’s ($9.2 billion).
The annual revenue of the highest-ranked male-owned STEM companies in the Fortune 500 (2024) #
| Company | Overall rank in the Fortune 500 | Total consecutive years on the Fortune 500 list | Revenue | Profit | Percentage change in profits from 2022 |
|---|---|---|---|---|---|
| State Grid | 3 | 24 | $545.9b | $9.2b | 12.4% |
| Saudi Aramco | 4 | 6 | $494.9b | $120.7b | -24.1% |
| Sinopec Group | 5 | 26 | $429.7b | $9.4b | -2.7% |
| China National Petroleum | 6 | 24 | $421.7b | $21.3b | 1% |
| Apple | 7 | 22 | $383.3b | $97b | -2.8% |
| Volkswagen | 11 | 30 | $348.4b | $17.9b | 10.5% |
| Exxon Mobil | 12 | 30 | $344.6b | $36b | -35.4% |
| Shell | 13 | 30 | $323.2b | $19.4b | -54.2% |
| China State Construction Engineering | 14 | 13 | $320.4b | $4.4b | 3.3% |
| Toyota Motor | 15 | 30 | $312b | $34.2b | 88.9% |
(Source: AIPRM)
The only other STEM companies with revenues exceeding $400 billion were Sinopec Group and China National Petroleum. The two Chinese petroleum companies generated revenue of $429.7 billion and $421.7 billion, respectively – the 5th and 6th highest totals in the entire Fortune 500.
Tech giant Apple rounded off the top five with an annual revenue of just over $383 billion – around 30% lower than State Grid. Despite this, Apple’s annual profit ($97 billion) was over 10 times more than State Grid ($9.2 billion) and the second highest in the top 10.
Despite having just the tenth highest revenue of all male-led STEM companies, Toyota Motors’ total of $312 billion was the 15th highest of any company in the Fortune 500. This means that two-thirds (66.6%) of the top 15 businesses in the Fortune 500 are male-led STEM organizations.
How has the number of female-led STEM companies in the Fortune 500 changed over time? #
Analysis of women in STEM statistics found that just 12 companies in the Fortune 500 were women-led STEM organizations in 2024. This was unchanged from the previous year and accounted for 2.4% of the overall total.
The number of female-led STEM companies has fluctuated since 2015, when the total stood at just eight. A near 13% decline in 2016 took the number to seven, with this number reaching nine by 2019 (+29%).
The number of female-led STEM companies in the Fortune 500, 2015-2024 #
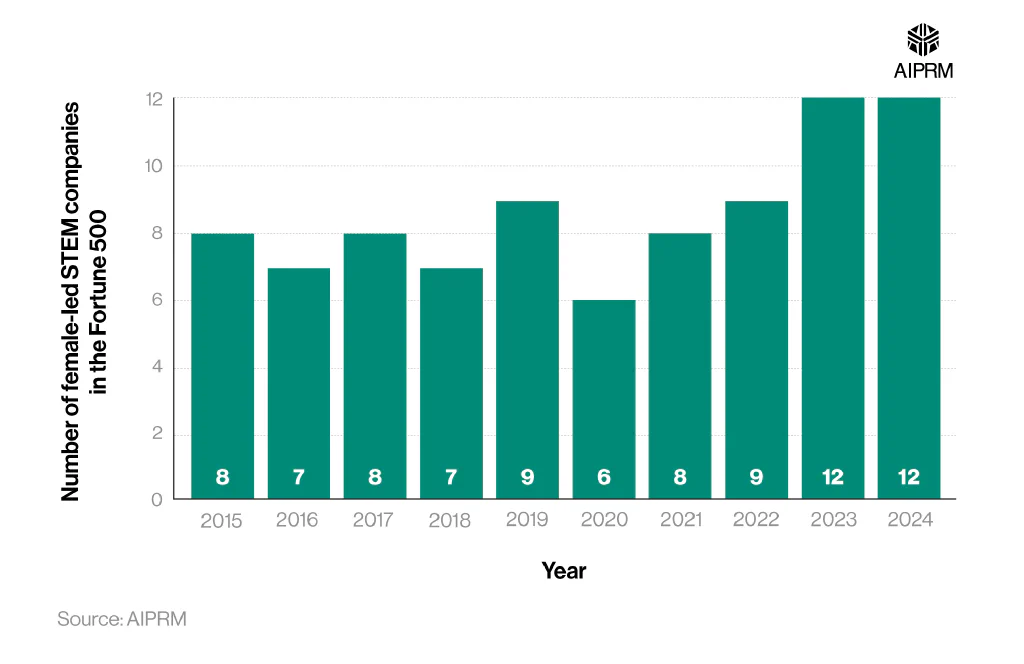
From here, numbers would fluctuate between six and nine before a third (33%) rise between 2022 and 2023 took the number past 10 for the first time.
Attitudes of women in STEM #
Recent women in STEM survey statistics found that nearly a quarter (24.17%) of women cited a lack of opportunities as a reason for not pursuing a career in STEM after their studies. This was the second most common response given, with around three-tenths (30.83%) claiming they’d found a different interest to pursue.
The most common reasons for not pursuing a career in STEM among surveyed women in 2024 #
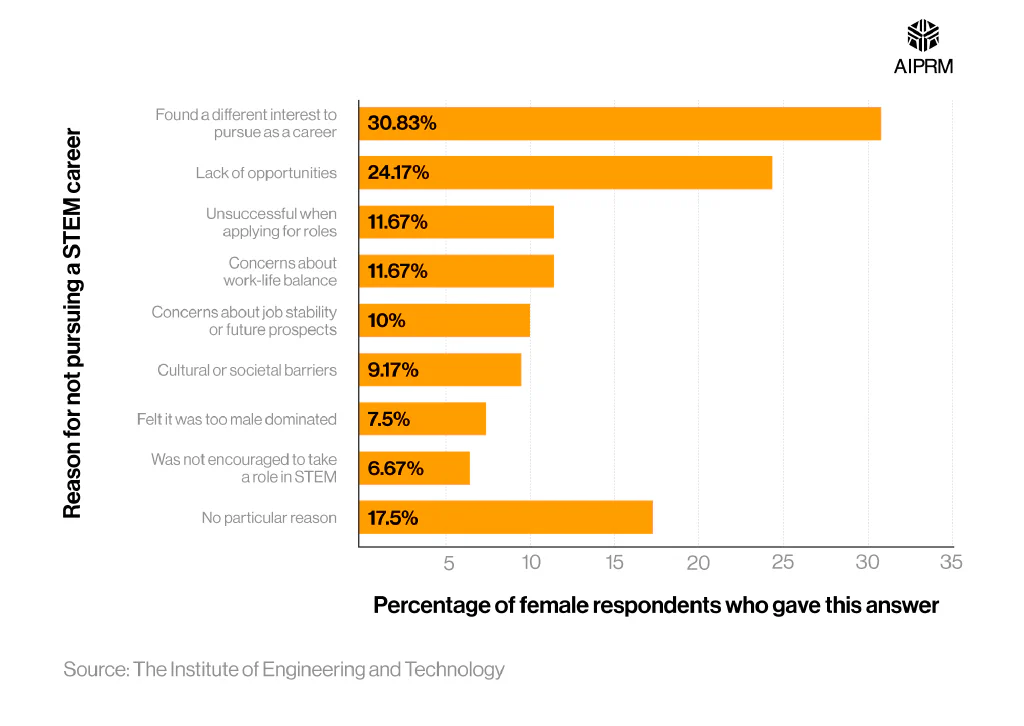
Just under 12% (11.67%) claimed they’d been unsuccessful when applying for STEM jobs, with an identical number expressing concerns about work-life balance.
A tenth (10%) cited concerns about job stability or future prospects as a deterrent, with just over 9% claiming cultural or societal barriers had stopped them.
What are the benefits of pursuing a career in STEM as a woman? #
Over a quarter (26.24%) of women considered doing an interesting job as a benefit of pursuing a STEM career, with just under a quarter (24.59%) citing the opportunity for better pay.
The most common benefits of working in STEM among surveyed women, 2024 #
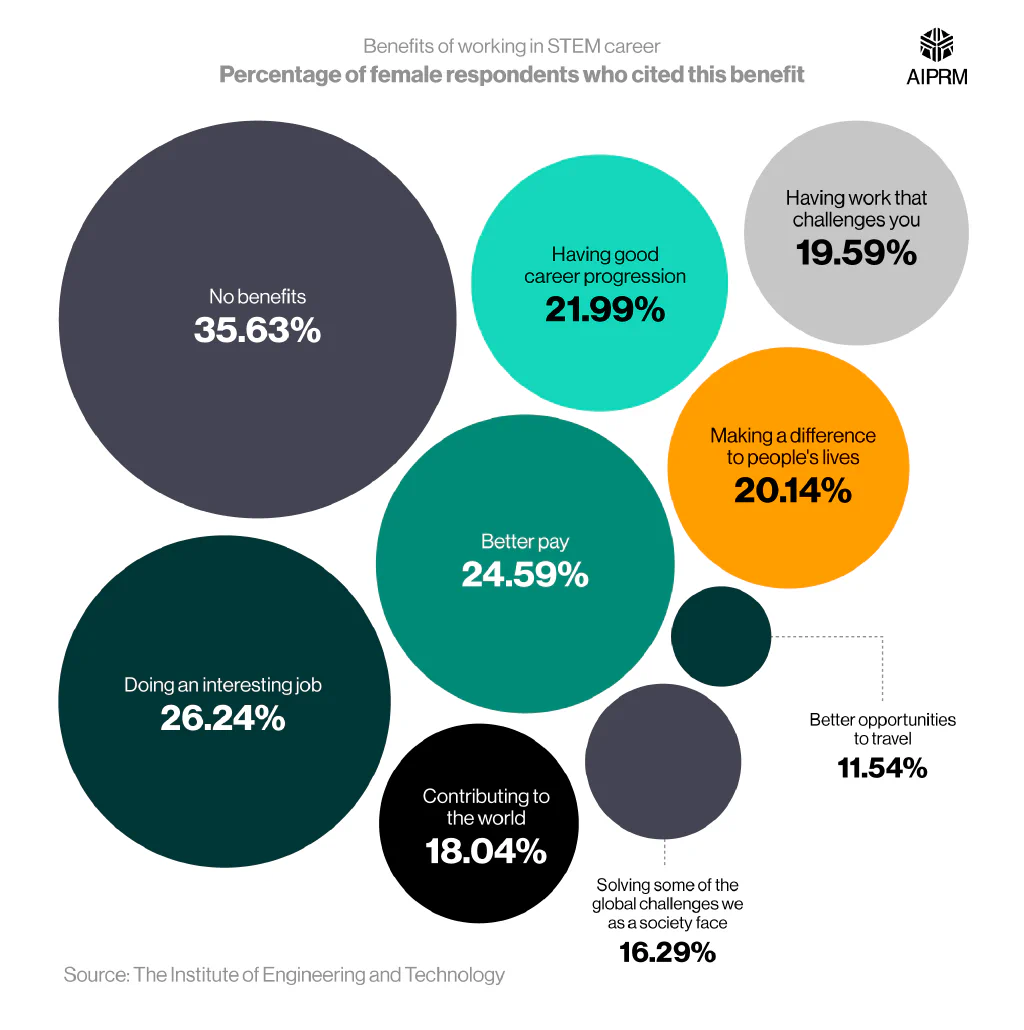
Around 22% considered the opportunity for career progression a key benefit, with just over a fifth (20.14%) citing the chance to make a difference in people’s lives.
At the other end of the scale, just over a tenth (11.54%) considered better traveling opportunities a key benefit of a STEM career – less than half the number who chose better pay.
Over a third (35.63%) of respondents said they did not see any benefits to working in STEM – nearly 10% more than any other answer.
What can be done to encourage more women to pursue a career in STEM? #
Nearly a quarter (23.99%) of surveyed respondents believe that encouragement from a young age will help increase the number of women pursuing STEM careers, with a similar number citing better career advice (22.14%) in schools.
The most common factors people feel will encourage more women to pursue a career in STEM, 2024 #
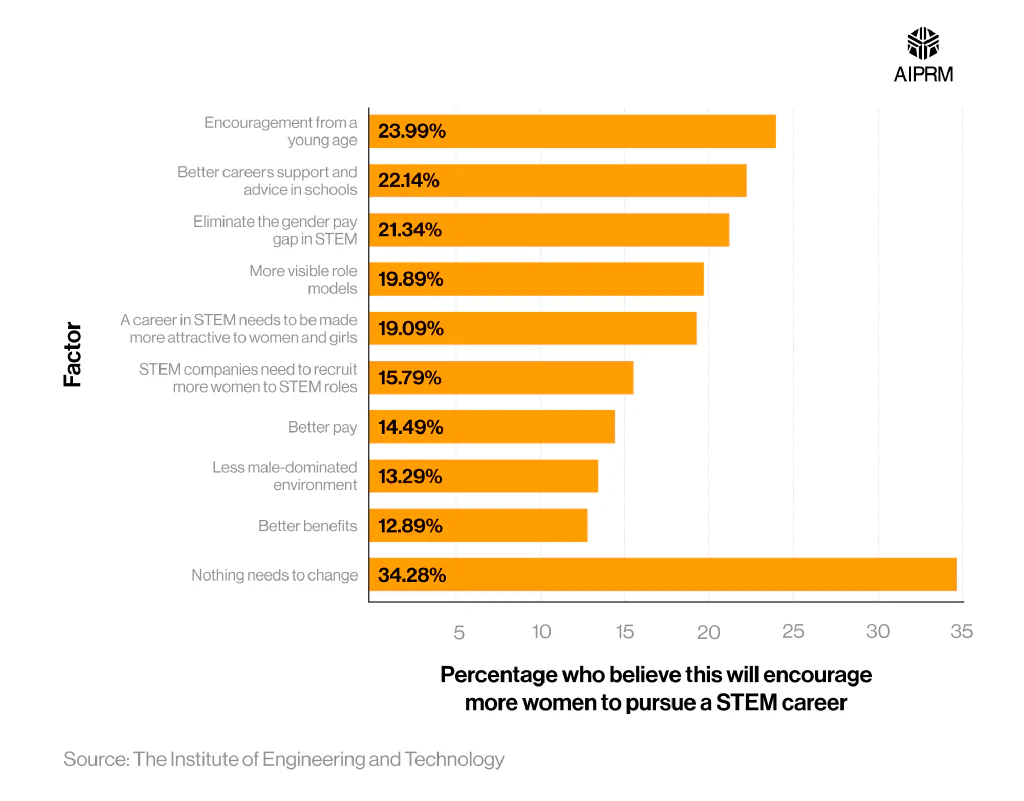
More than a fifth of respondents (21.34%) believed that eliminating the gender pay gap would encourage more women to pursue STEM careers, with under a fifth (19.89%) citing more visible role models as a key factor.
Elsewhere, over a third (34.28%) believed that nothing needed to change to encourage more women to pursue a career in STEM – over 10% more than any other response.
Women in STEM FAQs #
What does women in STEM mean?
Women in STEM refers to any woman working in the fields of science, technology, engineering, or mathematics.
Traditionally, women have participated less than men in many STEM fields – both in work and education. With an increasing global emphasis on women in STEM, it’s hoped that this gender gap will continue to close in the coming years.
What percentage of engineers are women?
Recent women in STEM statistics found that 15% of US engineers were women in 2022. This was 1% more than in 2010 (14%) and five times more than in 1970 (3%).
Why are there less women in STEM?
There are many reasons why women have been traditionally less represented than men in STEM, including:
- Gender pay gap
- Lack of encouragement to pursue STEM subjects during education
- Lack of women in the industry
- Public perception of STEM subjects being ‘male-oriented’
- Difficulty obtaining jobs in STEM fields compared to men
- Lack of career progression compared to men
Thankfully, there has been significant work across society to reduce all of these barriers, which has resulted in the number of women in STEM rising considerably over the last 50 years.
However, plenty of work is still required to eradicate the gap between men and women in STEM and encourage more female involvement.
How many women are in STEM?
A report from the National Center for Science and Engineering Statistics found that 12.3 million women worked in STEM occupations in the US as of 2021 – a rise of almost a third (31%) from 2011, when the number was 9.4 million.
How to get more women in STEM?
To encourage more women to pursue careers in STEM, there needs to be a systematic change in the educational system and the workplace. A report from the Institute of Engineering and Technology found that over a fifth (22.14%) of women believed that better career advice from schools was required to encourage female STEM participation, with a similar number (21.34%) believing the gender pay gap needed to be eliminated.
Greater encouragement and opportunities during school years can help more young girls develop a passion for STEM that sees them pursue a career down the road. Similarly, eradicating the gender gap in salaries and progression will make this career path appeal to more women. In time, these factors will result in more women working in STEM fields.
When is women in STEM day?
The International Day of Women and Girls in Science takes place on the 11th of February every year. The annual day was created by the United Nations General Assembly as a way of encouraging and mobilizing more women to pursue careers in STEM. The day typically sees talks, presentations, and seminars from prominent global industry figures to further the cause of women in science.
What percentage of computer professionals are female?
Just under a quarter (24%) of US computer professionals were women in 2022 – down 3% from 2010.
Glossary #
Computer Science #
Computer science is the study of computers and computerized systems. Examples of computer science are:
- Algorithms
- Software development
- Programming
- Coding
- Artificial Intelligence (AI) and assistive technologies
- Operating systems
Information Technology (IT) #
IT is the collective term for a set of fields, including computers, software, programming languages, information processing, and data storage.
Mathematical Science #
Mathematical science refers to a range of fields, including pure mathematics and other academic fields that apply mathematics. Examples of some of these fields include theoretical astronomy, theoretical physics, data science, and econometrics.
Social science #
Social science refers to the study of society, how people and institutions behave, and the effects of these behaviors on other people and the world. Examples of social science include psychology, sociology, economics, history, and political science.
STEM #
STEM is an acronym that categorizes science, technology, engineering, and mathematics. The term is typically used to refer to these subjects collectively for education and employment/industry purposes.
Sources and methodology #
https://www.dol.gov/agencies/wb/data/occupations-stem
https://ncses.nsf.gov/pubs/nsb20245/
https://www.womentech.net/en-us/women-in-tech-stats
https://www.eeoc.gov/special-topics-annual-report-women-stem
https://www.catalyst.org/research/women-in-science-technology-engineering-and-mathematics-stem/
https://www.wisecampaign.org.uk/updated-workforce-statistics-september-2023
https://www.stemwomen.com/women-in-stem-statistics-progress-and-challenges
https://professionalprograms.mit.edu/blog/leadership/the-gender-gap-in-stem/
https://www.ironhack.com/gb/blog/the-gender-gap-in-tech-let-s-talk-about-it
https://www.concept-it.com/black-history-month-2023-empowering-bame-women-in-stem/
https://www.stemwomen.com/bame-women-in-stem
https://www.catalyst.org/research/women-of-color-in-the-united-states/
Which European countries have the highest/lowest percentage of women in STEM? #
AIPRM sought to analyze statistics of women in STEM industries. For that, the number of women and men in the active workforce working in STEM was collected from eurostat.com. If a given country had a missing value, the linear forecast was used to predict employment.
What are the biggest female/male-led STEM companies worldwide? #
The statistics of the top 10 STEM women and men-led companies were compared from the Fortune 500 ranking. The industries which were taken into consideration as STEM industries were: Aerospace, Chemicals, Energy, Engineering, Motor Vehicles, and Technology.
To see how the number of STEM women and men-led companies changed over the years, the numbers of STEM women and men-led companies were collected from Fortune 500 rankings between 2015 and 2024. The percentage difference was then calculated.